Figure 4.
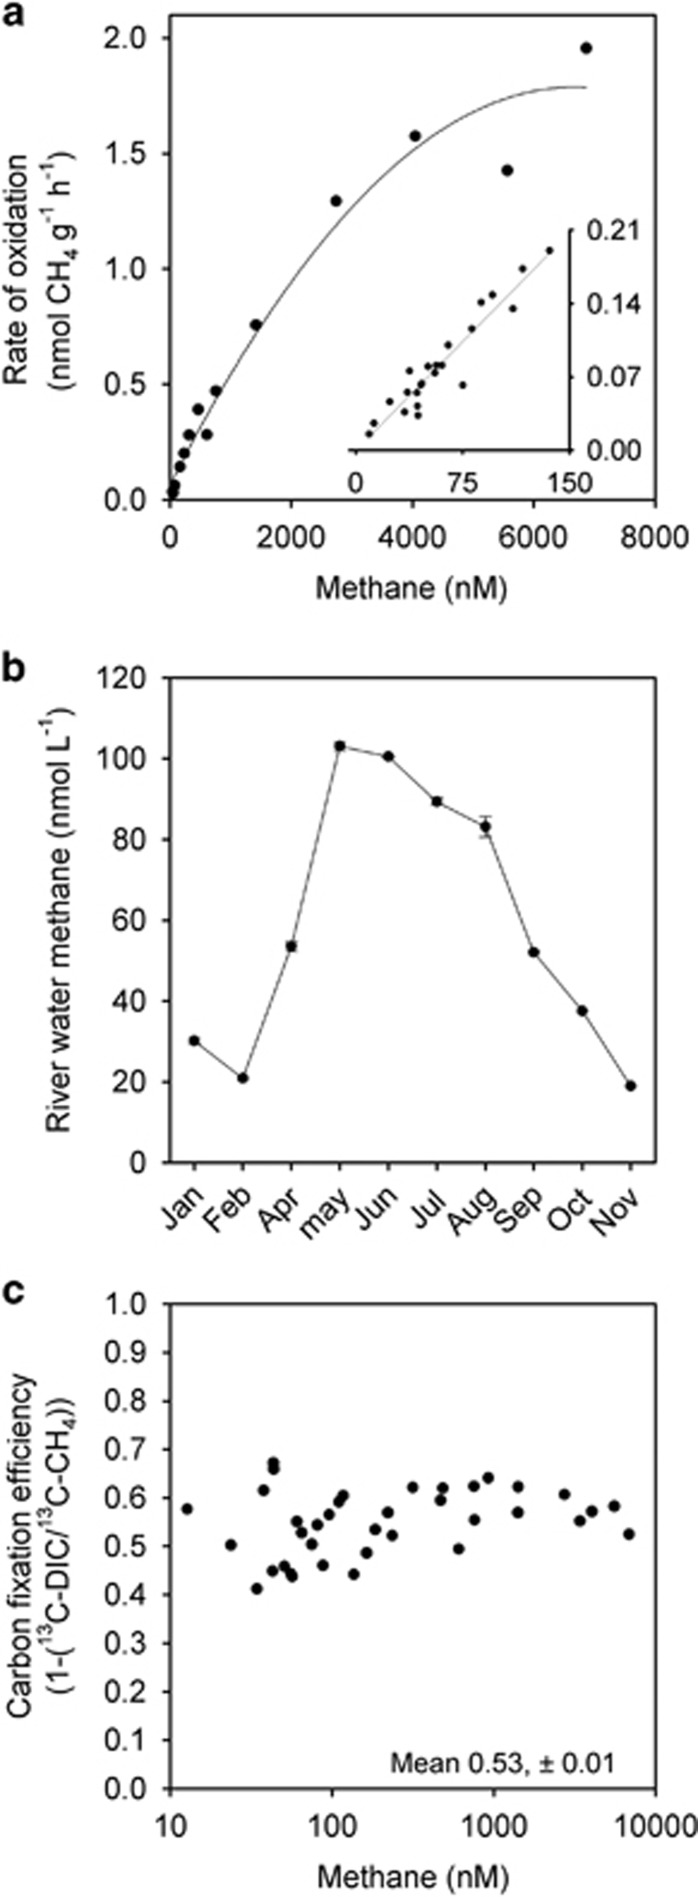
Kinetic effects of methane on its rate of oxidation and the efficiency of carbon fixation. (a) Rate of methane oxidation as a function of methane concentration from above and below ambient river concentrations (insert, first-order linear regression r2=0.90) to the point of near saturation (main panel, second-order polynomial, r2=0.97). (b) Annual pattern of river water methane in the Lambourn (see Shelley et al. (2014) for details and Sanders et al. (2007) for similar patterns). (c) CCE exhibiting no relationship with methane concentration from ~10 nM CH4 to 7000 nM CH4. Here the mean CCE value of 53% (±1) was indistinguishable to that determined either in the repeat batch incubations (52%,±6) or that from 13DIC over 15 h (52%,±2, see Figure 3). Each datum point is the result of a single incubation.

