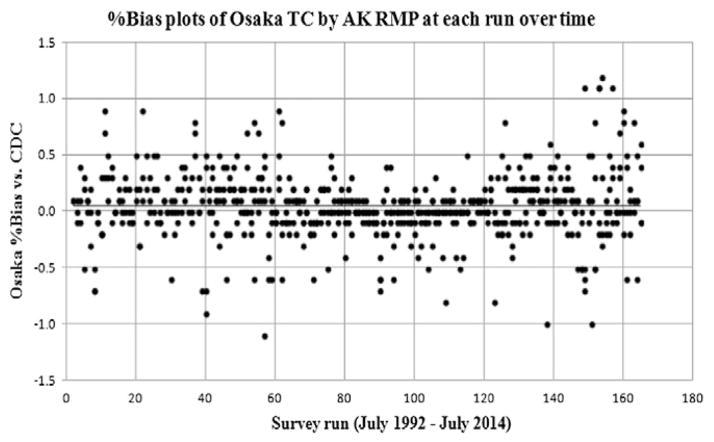
Fig. 3.
%Bias plots of Osaka TC by AK RMP at each run over time. Y-axis indicates Osaka %bias vs. CDC reference value and x-axis indicates each survey run from total 165 runs (July 1992 - July 2014). CDC: The US Centers for Disease Control and Prevention. AK RMP: Abell–Kendall reference measurement procedure. TC: total cholesterol.

