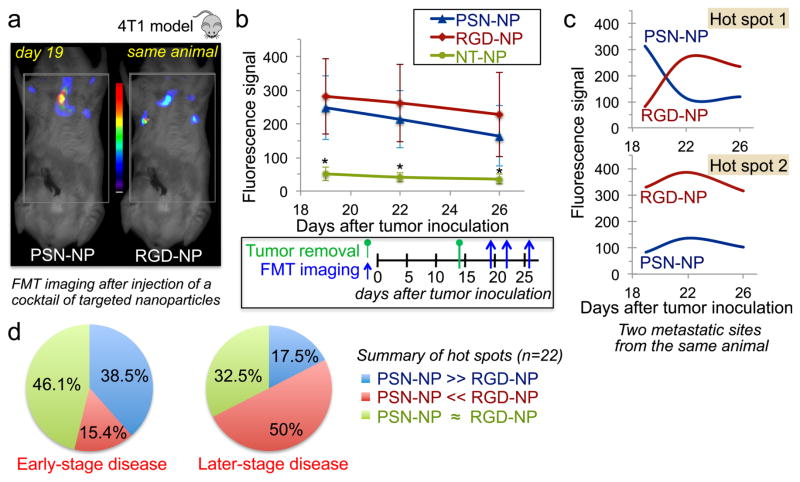
Figure 4. Spatiotemporal targeting of P-selectin and αvβ3 integrin in vivo in the 4T1 mouse model.
(a) Representative FMT images show targeting of nanoparticles to micrometastases 1 h post-injection in a mouse bearing 4T1 breast cancer metastasis. Mice with 4T1 metastasis (n=8 mice) were injected with a cocktail of αvβ3 integrin-targeting nanoparticles (RGD-NP), P-selectin-targeting nanoparticles (PSN-NP) and non-targeted nanoparticles (NT-NP) containing equal number of particles per formulation. (b) Quantification of the fluorescence signal from hot spots in the FMT images is shown for each formulation. Each animal presented 2–4 hot spots (total 22 hot spots). The animals were imaged at three different time points (t=19, 22 and 26 days after tumor inoculation) to capture early-stage and later stages of metastatic disease. (c) Two hot spots from the same animal show the time-course of signal for RGD-NP and PSN-NP. (d) Comparison of the signal for RGD-NP and PSN-NP was performed for each hot spot in the early-stage (t=19 days) and late-stage disease (t=26 days). To consider a signal of a targeted nanoparticle superior than that of the other formulation, it had to exhibit a difference of 100 pmoles of the fluorophore or greater, which corresponded to the considerable difference of 4×10¹¹ nanoparticles (~10% of the injected dose). Only signals above 80 pmoles of fluorescence were included in the analysis, since this was the detection threshold for the ‘non-specific’ signal of the non-targeted formulation.

