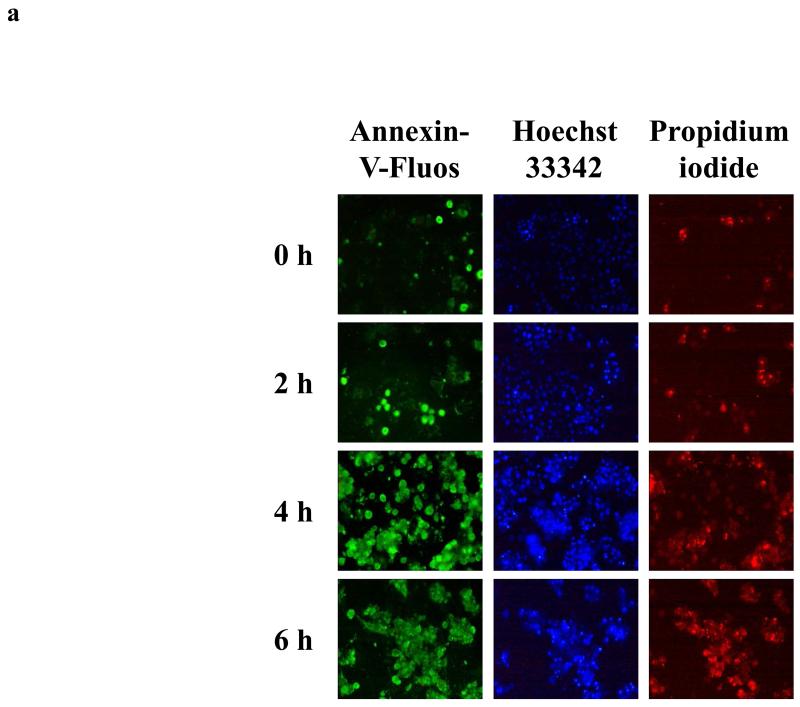
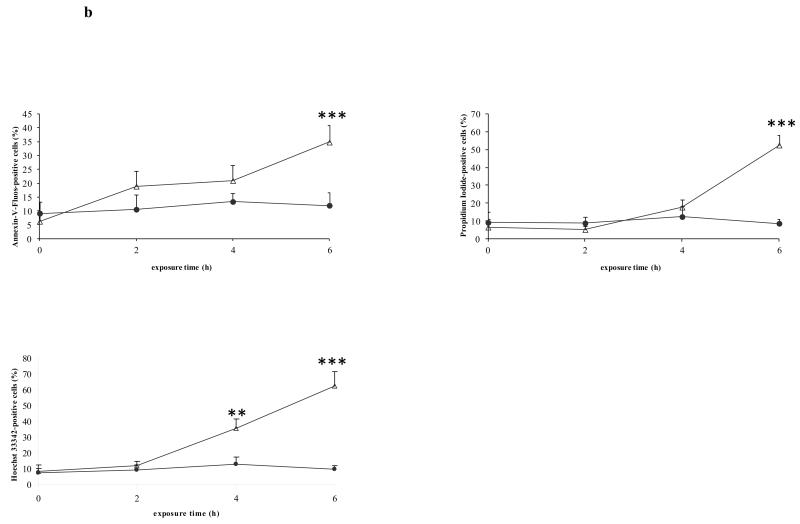
Figure 1. In situ staining of cell death markers.
Freshly isolated rat hepatocytes were cultivated in a monolayer configuration and were exposed to 200 ng/mL Fas ligand and 2 μg/mL cycloheximide, starting at 44 h postplating. a) Samples were taken at the start of the exposure (0 h), and after 2, 4 and 6 h, and were stained with annexin-V-fluos, Hoechst 33342 and propidium iodide. b) The number of cells, positive for the concerned marker, was counted in each image and expressed relative to the total number of nuclei present. Data are expressed as the mean ± standard deviation of 3 independent experiments. Results were evaluated by 1-way analysis of variance followed by post hoc Bonferroni tests. ● = control; Δ = Fas ligand/cycloheximide; **p < 0.01; ***p < 0.001. Reproduced in modified form with permission from (32).


