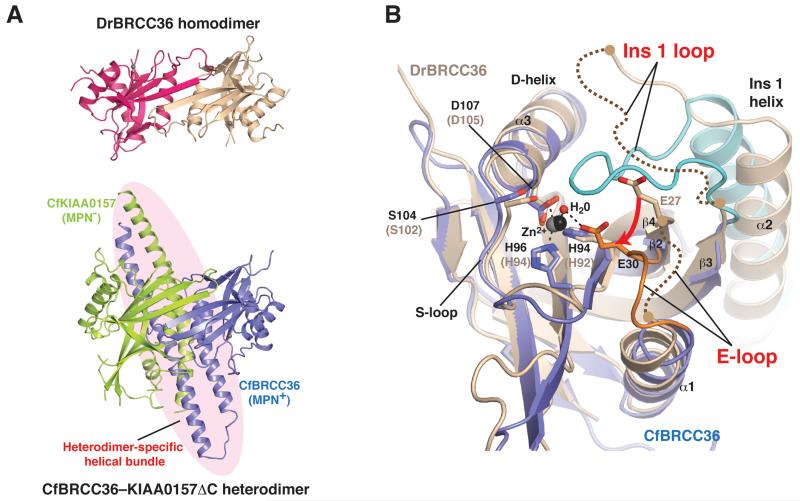
Figure 4. Comparison of the BRCC36 homodimer and BRCC36–KIAA0157 heterodimer.
A) Comparison of the DrBRCC36 homodimer (top panel) with the CfBRCC36–KIAA0157ΔC heterodimer (bottom panel) reveals similarities in MPN domain association but disorder of the helical bundle region.
B) Zoom in of the active site region of CfBRCC36 (blue) superimposed on DrBRCC36 (wheat). The CfKIAA0157ΔC subunit complexed to CfBRCC36 has been omitted for clarity. Active site residues are shown as sticks and Zn2+ atoms and a catalytic water molecule are represented as spheres. Disordered regions are shown as curved dashed lines. See also Figures S2, S3 and S7.

