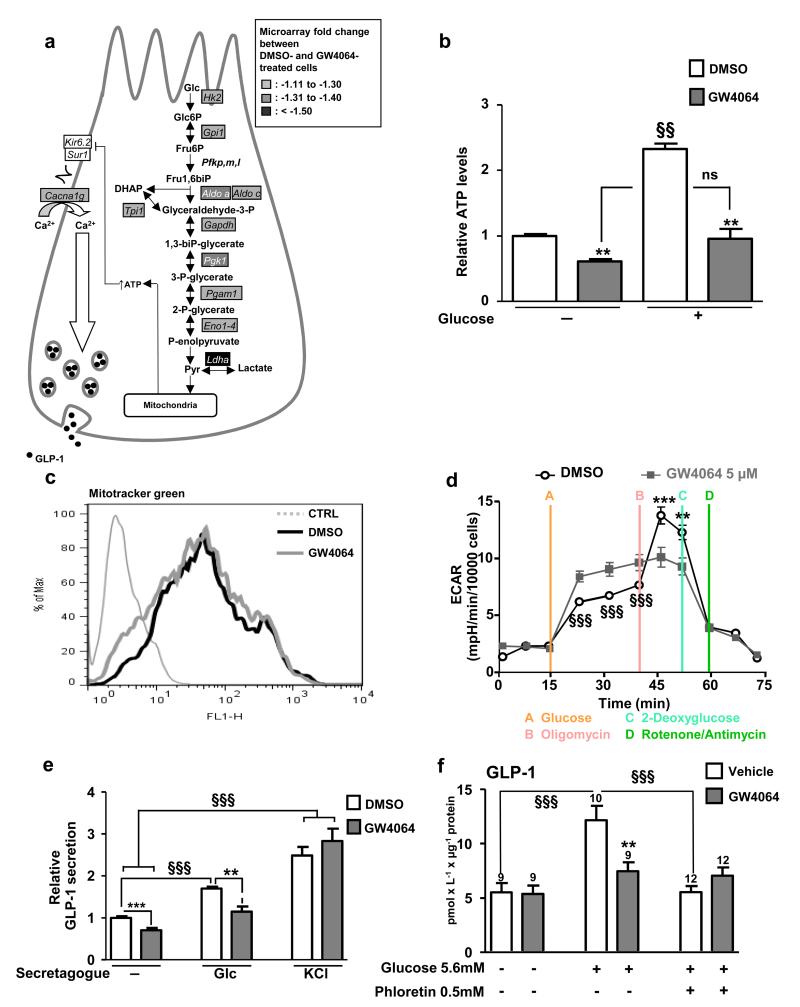
Figure 5. FXR inhibits GLP-1 secretion by decreasing glycolysis.
(a) DNA microarrays on 24h DMSO- and GW4064(5 μmol L−1)-treated GLUTag cells were performed using Agilent Technology. Genes whose expression is down-regulated by 10%, 10%- 30% and up-regulated by 50% after GW4064 treatment are written with black letters in rectangles filled in grey, with white letters in rectangles filled in grey and with white letters in black filled rectangles respectively. P value of the glycolysis biological process: P=4.33×10⁻⁶. (b) ATP measurements on GLUTag cells treated for 24h with GW4064(5 μmol L−1) and stimulated or not for 1h with glucose(5.6 mmol L−1). §§P≤0.01: effect of glucose on ATP levels. **P≤0.01: effect of GW4064 on ATP levels. (c) Fluorescence measurements by Mitotracker Green in GLUTag cells incubated with DMSO or GW4064 (n=3; performed 3 times). (d) Extracellular acidification rate (ECAR) after successive injection of glucose(10 mmol L−1), oligomycin(1μmol L−1), 2-deoxyglucose(100 mmol L−1) and rotenone(1μmol L−1)/antimycin A(1 μmol L−1) on GLUTag cells incubated 24h with DMSO or GW4064. §§§P≤0.001: effect of GW4064 on ECAR between t=15min and t=40min. **P≤0.01 & ***P≤0.001: effect of GW4064 on ECAR between t=40min and t=55min. Representative results of 4 independent experiments. (e) GLP-1 measurements in supernatants of GLUTag cells treated for 24h with GW4064(5 μmol L−1) and stimulated or not for 1h with glucose-(5.6 mmol L−1) or KCl-(30 mmol L−1) containing buffer (n=3; performed 4 times). **P≤0.01, ***P≤0.001: effect of GW4064 treatment in each secretion condition. §§§ P≤0.001: effect of secretagogue in each treatment condition. (f) GLP-1 measurements in supernatants of intestinal biopsies from WT mice treated for 5 days with Vehicle or with GW4064(30mpk) and then stimulated with medium alone, medium plus glucose(5.6 mM) or medium plus glucose(5.6 mol L−1) plus phloretin(0.5 mmol L−1). **P≤0.01: effect of GW4064 treatment on GLP-1 secretion in each secretion condition. §§§P≤0.001: effect of secretagogues on each treatment condition. On the bars, number of biopsies used from 3 Vehicle- or GW4064 (30mpk)-treated mice. Data are represented as mean +/−SD (b,d,e) or mean +/− SEM (f). Statistical analysis were performed using Two-Way ANOVA analysis followed by Bonferronni’s post-hoc test.

