
Fig. 5.
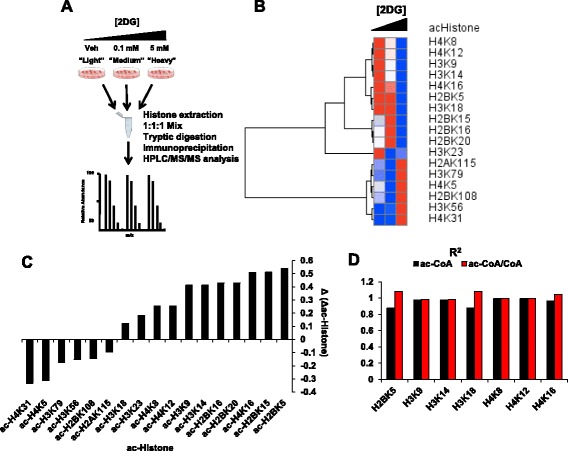
Quantitative proteomics identifies specific dose-dependent changes in histone acetylation. a Schematic of SILAC experiment workflow. b Heatmap of all detected histone acetylated residues in response to 2DG treatment. Values are row-normalized with red denoting high and blue denoting low. c Correlation coefficients of acetylated histones in relation to CoA and ac-CoA levels. d Quantification of the difference in sensitivity of ac-Histone residues to 2DG treatment