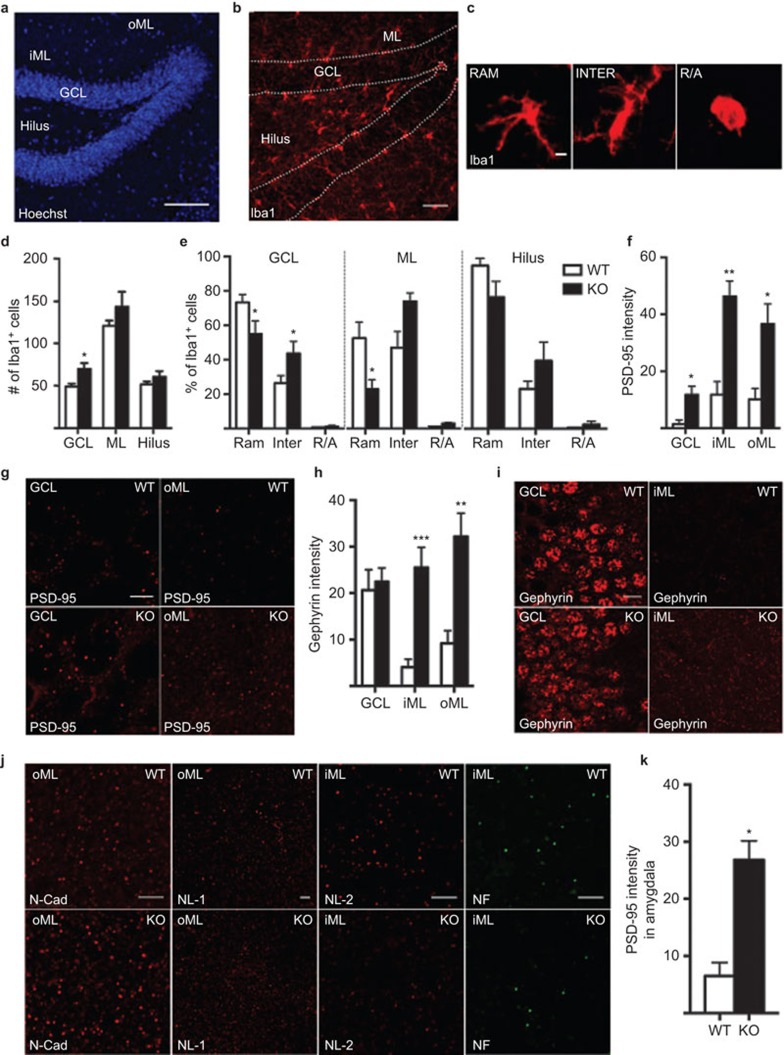
Figure 1.
Representative images showing the cytoarchitecture with nuclear staining (Hoechst) (a) and Iba1+ microglia (b) in the dentate gyrus of the hippocampus, including the hilus, GCL, iML and oML. (c) Images of different microglial morphological phenotypes, including RAM, INTER and R/A Iba1+ cells. Quantification of Iba1+ cell number per section (d), relative percentage of 80 Iba1+ microglia per animal with different morphologies (e), quantification of PSD-95 protein intensity (mean gray value in confocal pictures imported into ImageJ software, measured per representative region of interest from 3–4 coronal brain sections per animal, from −1.46 mm to −2.46 mm posterior to bregma6 (f), images of PSD-95 expression (g), quantification of gephyrin protein intensity (h), images of gephyrin expression (i) in WT and IL-1R1 KO mice. (j) Representative images of N-cad and NL-1 in the oML and NL-2 and NF in the iML of WT and IL-1R1 KO mice. (k) Quantification of PSD-95 protein intensity in amygdala. All analyses were conducted by researchers who were blinded to the treatment conditions. Data are presented as the means±SEM *P≤0.05. N=4–8 for WT and n=3–5 for IL-1R1 KO group. All comparisons were performed using an unpaired Student's t-test except in (e), for which two-way analyses of variance followed by the Bonferroni post hoc test were used for analyzing microglia morphology. Scale bars are 100 µm in a, 50 µm in b, 10 µm in i and 5 µm in c, g and j. GCL, granule cell layer; iML, inner molecular layer; INTER, intermediate; KO, knockout; N-cad, N-cadherin; NF, neurofascin; NL-1, neuroligin-1; oML, outer molecular layer; PSD-95, postsynaptic density-95; R/A, round/ameboid; RAM, ramified; WT, wild-type.

