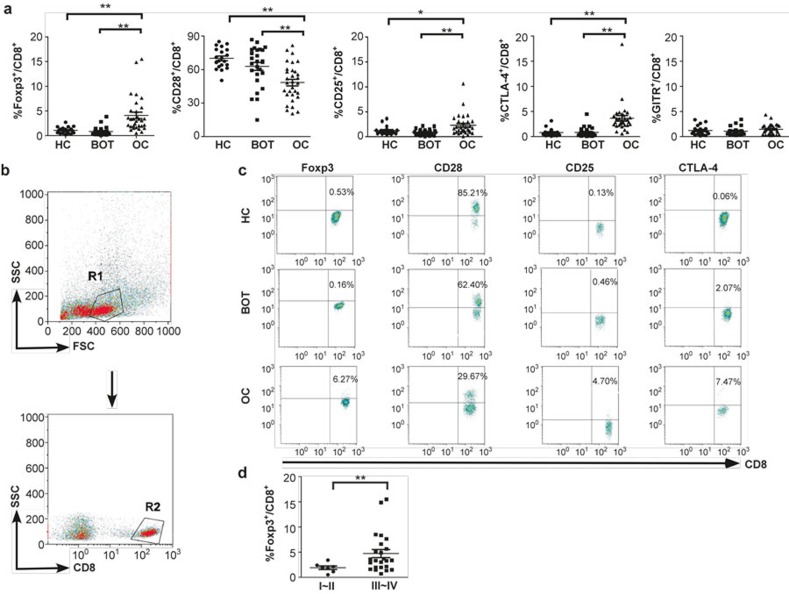
Figure 3.
The expression of Treg markers in the CD8+ T cells from the PBMCs of ovarian cancer patients. (a) The PBMCs from the OC patients, BOT patients, and healthy controls were stained with PE-, APC-, or FITC-labeled mAbs against human CD8, CD25, GITR, Foxp3, CTLA-4, or CD28 molecules, according to the staining protocol described in “Materials and Methods” section. The cumulative data showed an increased expression of CD25, Foxp3, and CTLA-4, and a decreased expression of CD28 in the CD8+ T cells from the PBMCs of OC patients (n = 31) compared with that in the CD8+ T cells from the PBMCs of the BOT patients (n = 26) and healthy controls (n = 20). (b) The gating strategy: the lymphocytes (R1) were gated according to their side- and forward-scatter properties, and the CD8+ T cells (R2) were gated from R1. (c) Representative dot plots of CD8 and Foxp3, CD28, CD25, and CTLA-4 staining of the PBMCs from the OC patients, BOT patients, and healthy controls. (d) The cumulative data showed that the percentage of Foxp3+ T cells among the CD8+ T cells from the PBMCs of the OC patients at stage III/IV (n = 24) was higher than that in the patients at stage I/II (n = 7). All of the graphs show the mean ± SEM. *P < 0.05, **P < 0.01, Mann–Whitney U-test.

