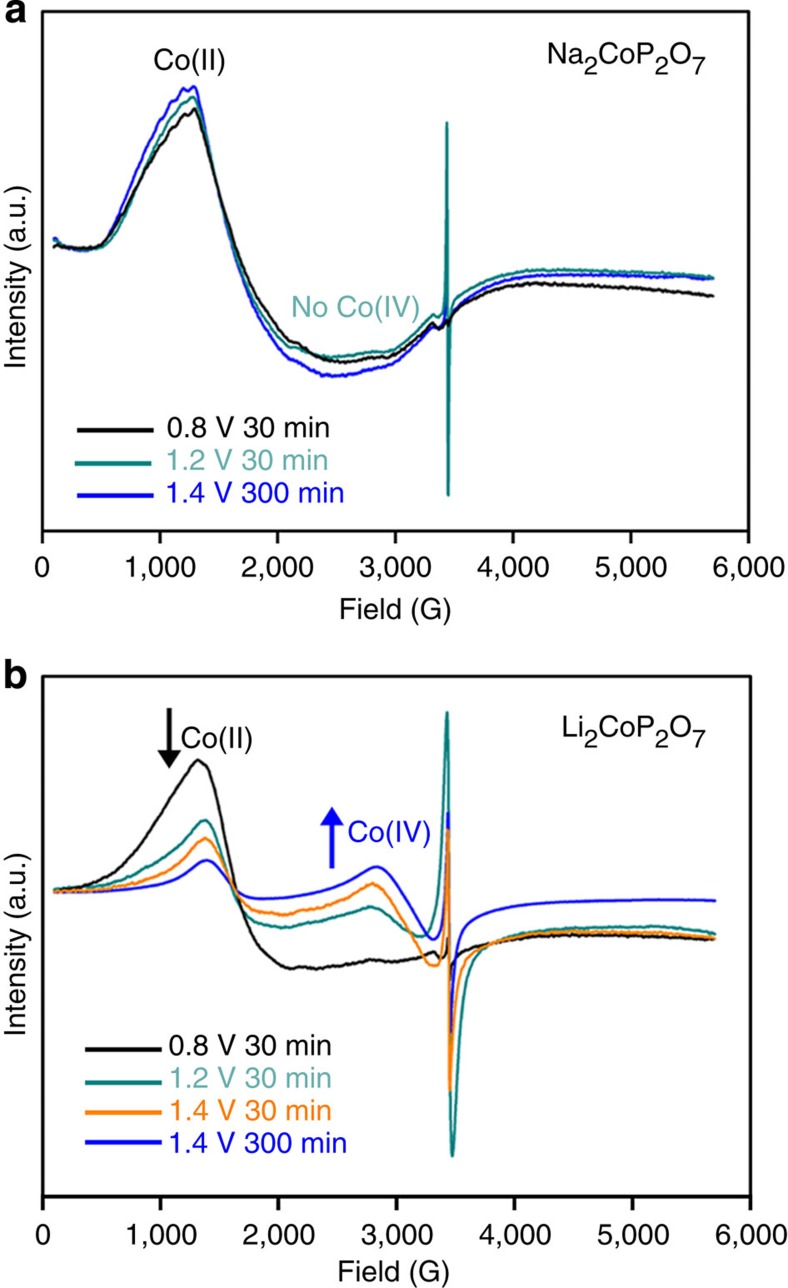
Figure 5. Continuous wave X-band EPR spectra for Na2CoP2O7 and Li2CoP2O7 on bulk electrolysis.
(a) EPR spectra for Na2CoP2O7 at 0.8 V for 30 min (black), 1.2 V for 30 min (green) and 1.4 V for 300 min (blue). Only Co(II) signals at geff≈5 appeared on bulk electrolysis. Here, the signal at g=2 is originated from carbon. (b) EPR spectra for Li2CoP2O7 at 0.8 V for 30 min (black), 1.2 V for 30 min (green), 1.4 V for 30 min (orange) and 1.4 V for 300 min (blue). Contrary to Na2CoP2O7, a decrease in Co(II) signals with a concurrent increase in Co(IV) signals (geff≈2.3) was observed with the increase in applied voltage and time.

