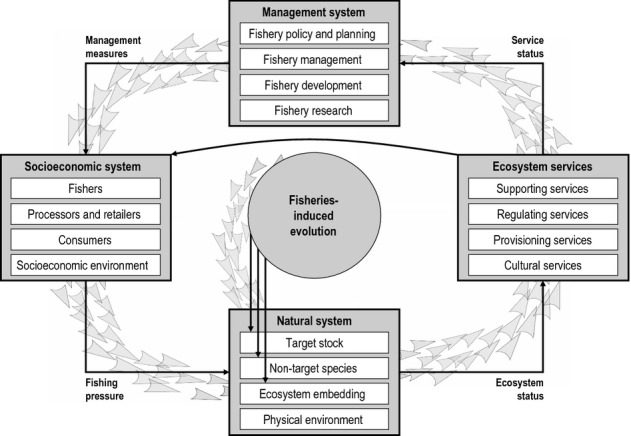
Figure 1.

Schematic illustration of the interactions among the main components of a fishery system. The thin black arrows represent direct interactions, whereas the grey triangular arrows illustrate how the direct effects of fisheries-induced evolution (FIE) on the natural system cascade through the fishery system, affecting fishery management and the socioeconomic system through their impacts on ecosystem services (see Fig. 2 for an example detailing such a cascading effect).
