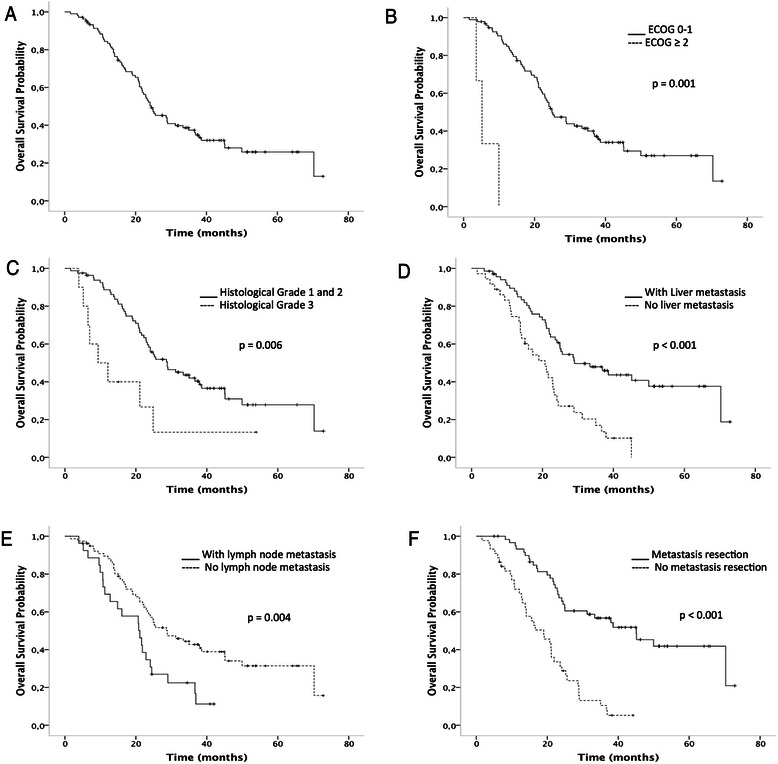
Fig. 3.

The overall survival curves from the start of bevacizumab treatment. Overall survival curve from the total cohort (n = 105 patients), median of 24.4 months (a). Overall survival curves according to: ECOG (1 = ECOG 0, 1 vs. 2 = ECOG 2, 3), p = 0.001 (b); histogical grade (well differentiated = grade 1, moderately differentiated = grade 2 vs. poorly differentiated = grade 3), p = 0.006 (c); liver metastasis (yes vs. no), p < 0.001 (d); lymph node metastasis (yes vs. no), p = 0.004 (e), and patients who underwent metastasis resection (yes vs. no), p < 0.001 (f). The survival curves were calculated using the Kaplan-Meier method, and the log-rank test was used for comparison. ECOG: Eastern Cooperative Oncology Group performance status score
