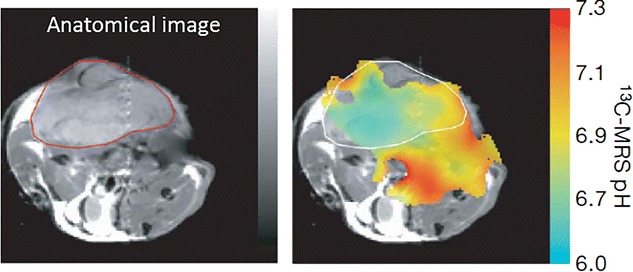
Fig. 2.

pH mapping of tumor tissue. Anatomical image is showing a subcutaneously implanted EL4 tumor. The pH map generated by calculating the ratio of the hyperpolarized H13CO3 and 13CO2 voxel intensities using handersal-hasselbatch equation. Reproduced with permission from the Nature Publishing Group and Gallagher et al. [78]
