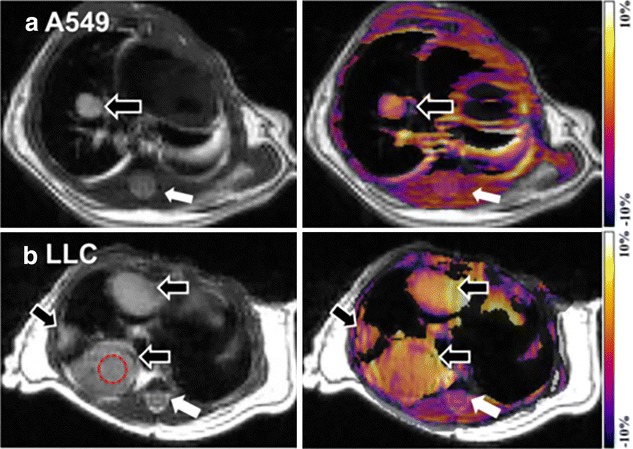
Fig. 6.

APT imaging of lung tumors. Anatomical proton weighted image and APT-weighted images of A549 (a) and LLC (b) tumors in mouse model. Both the tumors showed higher APT contrast than surrounding tissues including spinal cord (white arrows) and skeletal muscles. Higher CEST contrast is detectable on LLC tumor than A549 tumor (black arrow). Reproduced with permission from Public Library of Science and Togao et al. [84]
