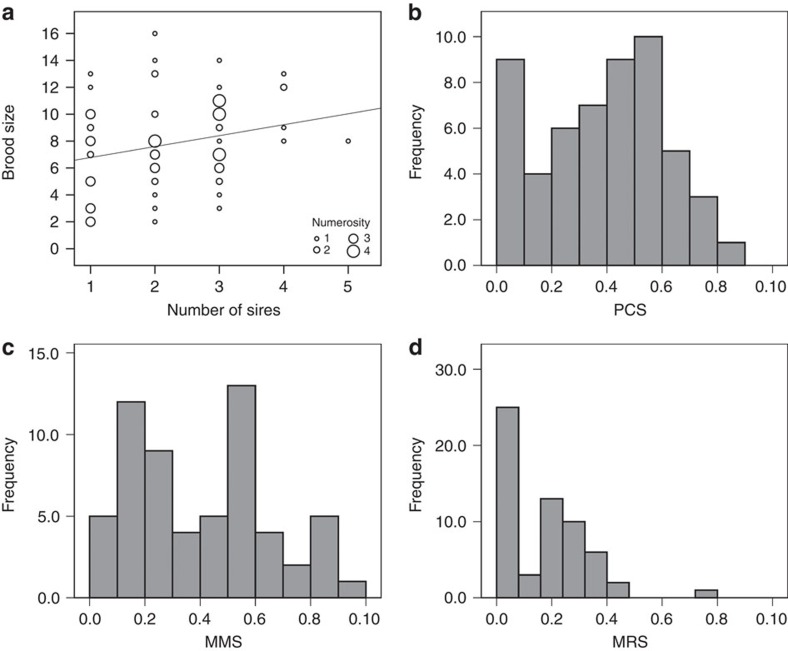
Figure 1. Descriptive statistics of data from replicated populations.
(a) Correlation (Pearson's r=0.246, P=0.044, n=68) between number of sires per brood and brood size, where different sizes for circles correspond to different number of cases. Frequency distributions of male (b) postcopulatory success (PCS, n=54), (c) mating success (MMS, n=60) and (d) reproductive success (MRS, n=60), respectively.

