
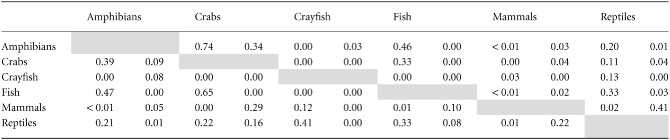
Table 3.
Correlation matrix of spatial congruence between geographical ranges of freshwater vertebrate and decapod taxa world-wide. The proportion of grid cells for each pairwise comparison of taxa are given for two measures of diversity, (left) total species richness and (right) threatened-species richness. A value of 1 implies perfect correlation between taxa. The comparison is presented for the richest 5% of grid cells for each taxon for both metrics of diversity
 |