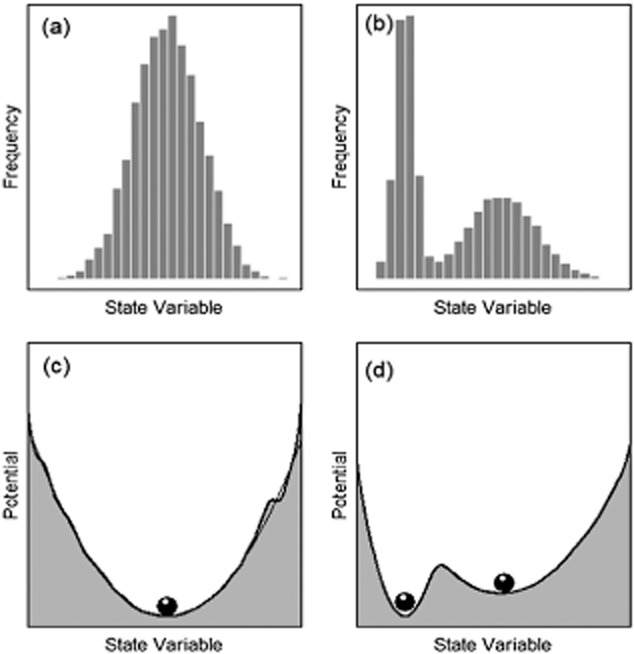
Figure 1.

Representations of unimodal (left) and multimodal (right) systems in ecosystem state-space. (a), (b) Frequency histograms of a state variable (e.g. the frequency of observations of particular tree cover values). (c), (d) ‘Potential’ (U) diagrams estimated using the approach of Livina et al., 2010, where U ∼ –log(pd), and pd is a Gaussian-kernel probability density of the associated histograms. ‘Marbles’ indicate the location of inferred stable attractors.
