
Figure 3.
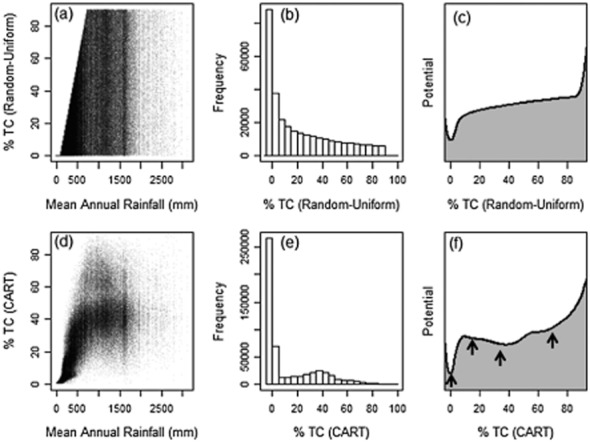
Tree cover (TC)–rainfall relationship (a), tree-cover frequency histogram (b) and ‘potential’ (c) drawn from a uniformly distributed pseudo-tree cover dataset (τ) for Africa, and similar relationships (d, e and f) following classification and regression-tree (CART) analysis. Figures (a)–(c) are based on the map shown in Fig. 2 (b), while (d)–(f) are based on the map shown in Fig. 2 (c). These analyses show how the CART-based abstraction of the uniformly distributed data has discontinuities in (d) and (e) not present in the original data (a) and (b). Using the method of Livina et al. (2010) the CART data result in the identification of four distinct basins of attraction (marked with arrows) and associated bifurcation points (f) where the original data (c) reflect only the spatial dominance of deserts in the African land mass and a single basin. Note that this analysis using pseudo-data highlights how CART-based geospatial analyses may produce discontinuities: the analysis is not intended to duplicate actual patterns of tree cover in Africa.