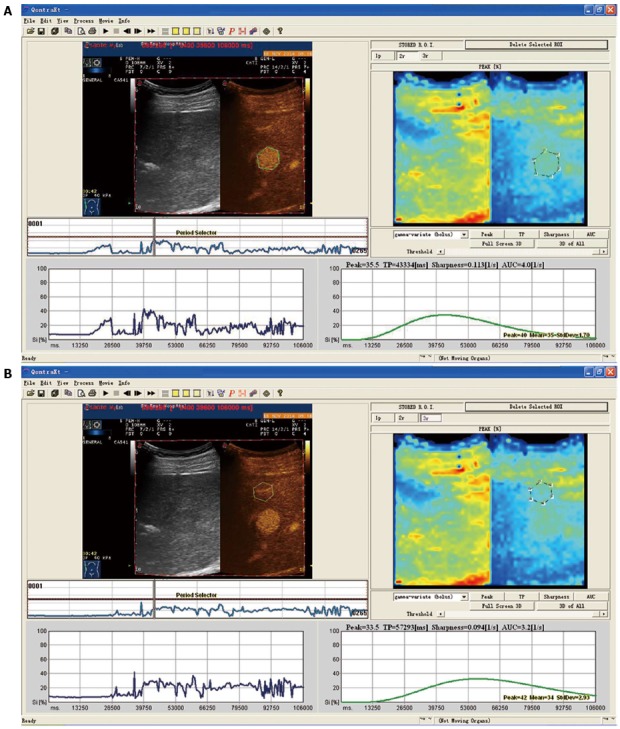
Figure 2.

Time-intensity curve of patients in the recurrence group. A: Time-intensity curve of ROI in the tumor. The green curve was steep, and indicated that the change in intensity was obvious. The Peak was 35.5% and TP was 43.33 s; B: Time-intensity curve of ROI beyond the tumor. The green curve was gentler, compared with the ROI curve in the tumor. The Peak was 33.5% and TP was 57.29 s. ROI: Region of interest.
