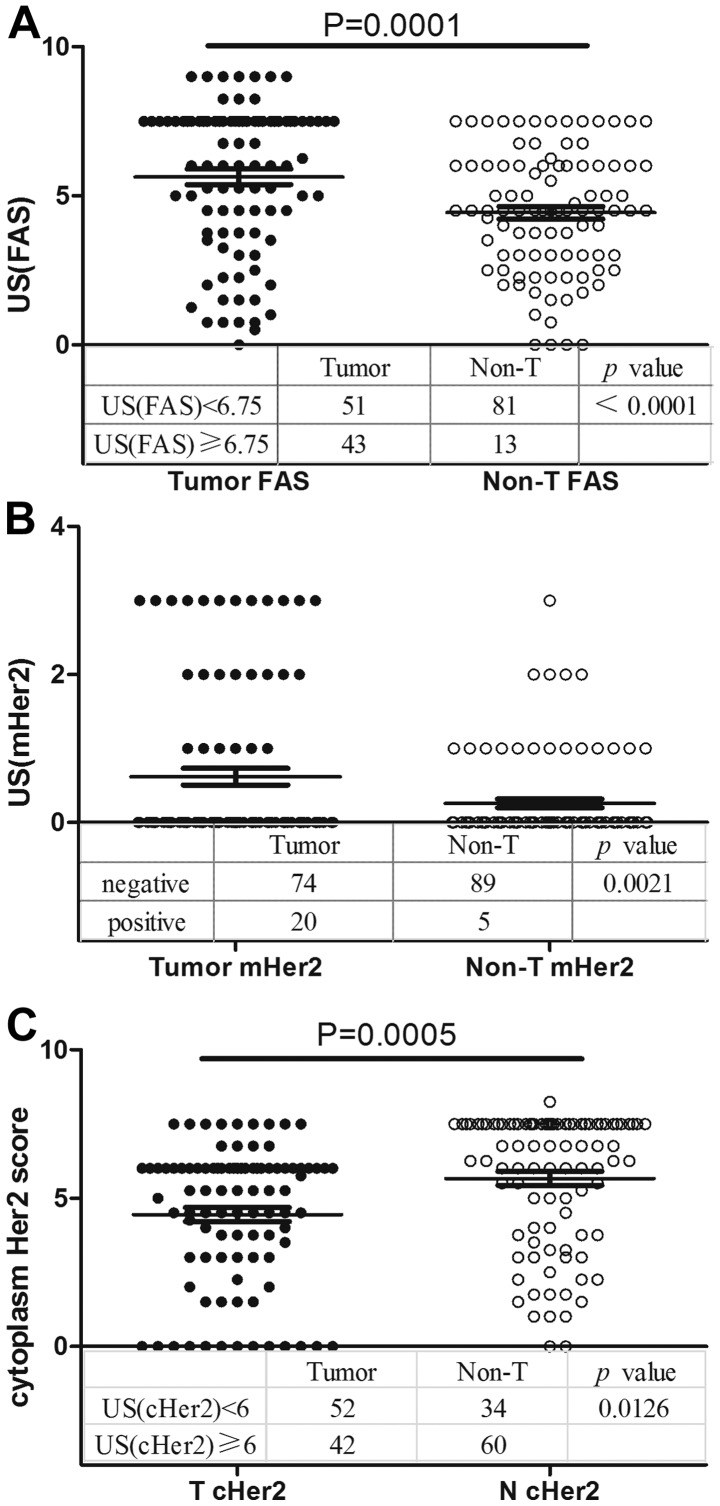
Figure 2.
Expression of FAS and HER2 in tumor and non-tumor (non-T) tissues. (A) Comparison of FAS expression between tumor and non-tumor tissues. The gastric cancer (GC) tissues overexpressed FAS (5.633±0.510 vs. 4.431±0.423; P=0.0001; Mann-Whitney rank test; or P<0.0001; χ2 test). (B) Comparison of mHER2 staining status between tumor and non-tumor tissues. HER2 was significantly overexpressed in the GC tissues compared with the non-tumor tissues (P=0.0027; χ2 test). (C) Comparison of cHER2 expression between tumor and non-tumor tissues. Unexpectedly, in contrast to mHER2, cHER2 was underexpressed in the GC tissues (4.441±0.481 vs. 5.662±0.465; P=0.0005; Mann-Whitney rank test; or P=0.0126; χ2 test). FAS, fatty acid synthase; mHER2, membranous human epidermal growth factor receptor 2; cHER2, cytoplasmic HER2; US, ultimate score.

