
Figure 3.
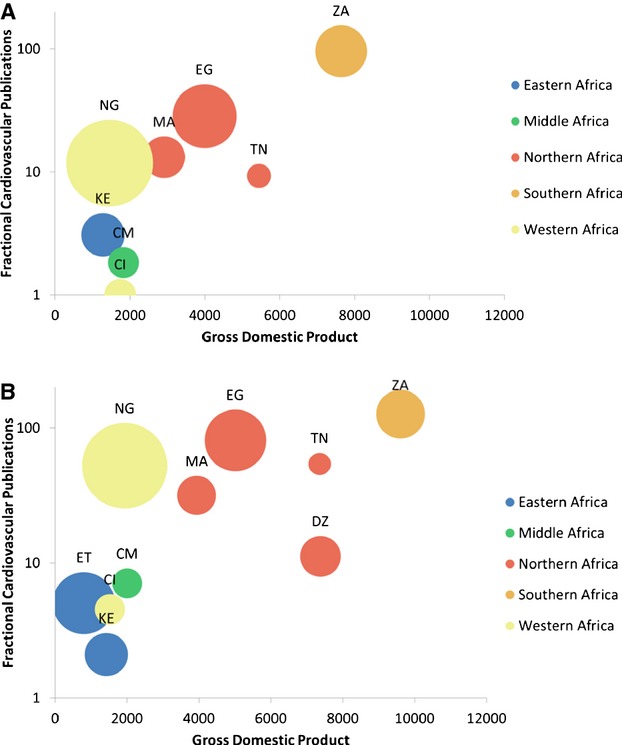
Cardiovascular publications vs gross domestic product in 2000 and 2008. Fractional cardiovascular publications are shown on a logarithmic scale vs gross domestic product for 2000 (A) and 2008 (B). Only countries with a >5.0 fractional count of cardiovascular publications are displayed. Country abbreviations are as in Figure 2 and are color‐coded according to United Nations Millennium Development regional classifications. The size of the bubble represents population size.