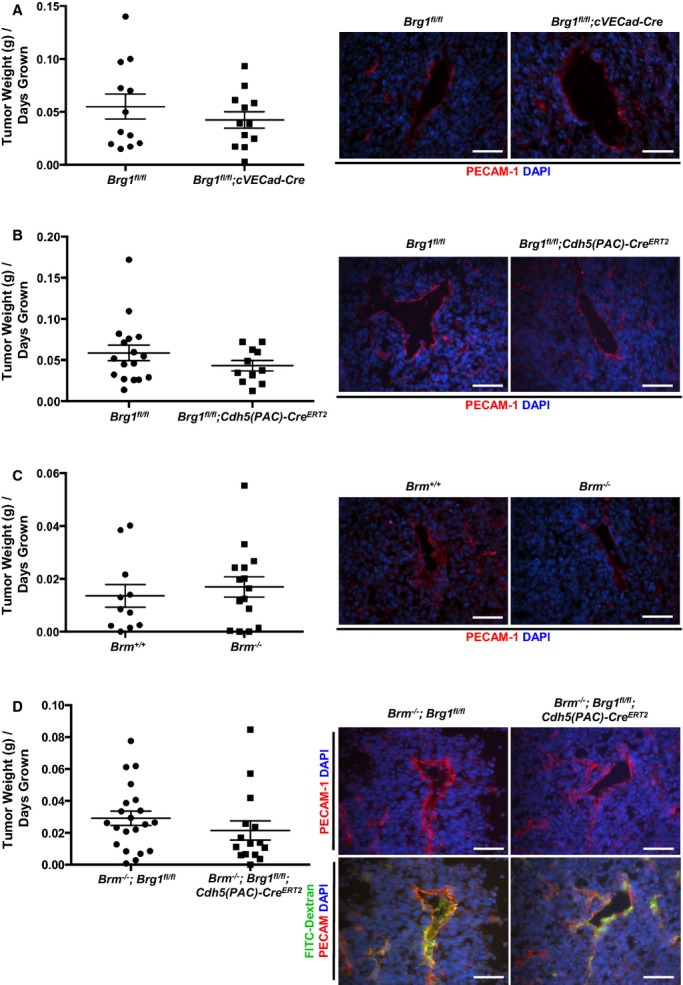
Figure 5.

Lewis lung carcinoma (LLC) tumor growth and vascularization are comparable in control and SWI/SNF mutant animals. A through D, LLC cells were subcutaneously injected into the flank of 8‐ to 10‐week‐old female mice, and tumor growth was monitored every other day until tumors reached a diameter of ≈2 cm, at which time animals were sacrificed and tumors were weighed. Average tumor size (grams) per days grown for 11 to 21 animals from each genotype are shown on the left. Representative images of tumor sections stained for PECAM‐1 (red) for visualization of tumor vasculature are shown on the right. Nuclei are stained with DAPI (blue). Control and Brm/Brg1 double‐mutant animals were tail‐vein injected with FITC/dextran (2000 kDa, green; bottom panel of D) before animals were sacrificed to assess tumor vessel integrity. Scale bars=50 μm. Brg1 indicates Brahma‐related gene 1; Brm, Brahma; DAPI, 4′,6‐diamidino‐2‐phenylindole; FITC, fluorescein isothiocyanate; SWI/SNF, SWItch/Sucrose NonFermentable.
