
Figure 16.
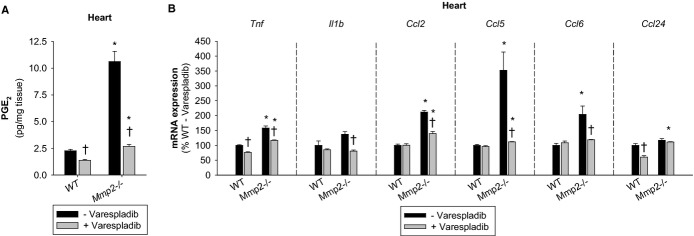
Emerging functions of the MMP‐2/sPLA2 axis in cardiac inflammatory gene expression. A, Cardiac PGE2 concentrations in mice treated with or without varespladib (10 mg/kg per day for 2 days). Pools of n=3 mice per genotype were measured in duplicate. B, qRT‐PCR of inflammatory marker genes in mice treated with or without varespladib (10 mg/kg per day for 2 days). n=3 mice per genotype. *P≤0.05 vs WT−Varespladib (control). †P≤0.05 vs Mmp2−/−−Varespladib (control). All pairwise multiple comparisons vs control group (Holm–Sidak method). MMP indicates matrix metalloproteinase; PGE2, prostaglandin E2; qRT‐PCR, quantitative real‐time polymerase chain reaction; sPLA2, secreted phospholipase A2; WT, wild‐type.