
Figure 2.
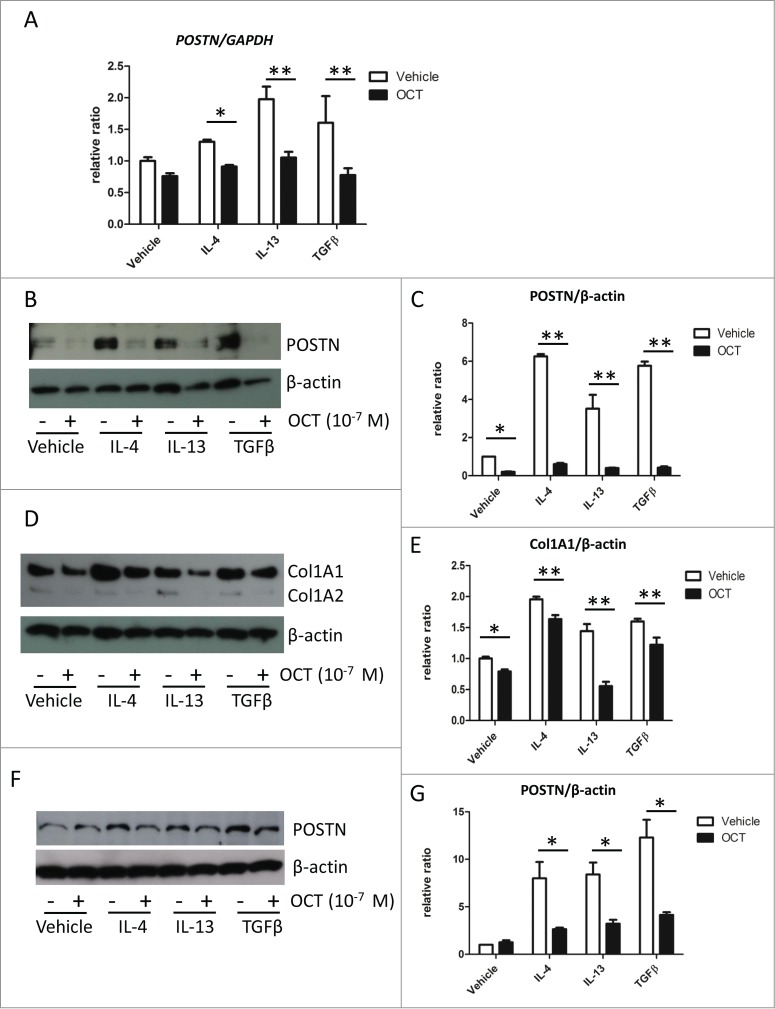
OCT causes downregulation of IL-4-, IL-13-, and TGFβ-induced POSTN and Col1A1 expressions in fibroblasts. (A) Mouse dermal fibroblasts were pre-treated with 10−7 M of OCT for 2 h and treated with IL-4 (10 ng/ml), IL-13 (10 ng/ml), or TGFβ (10 ng/ml) for additional 24 h. Bars indicate the mean ± SD. N = 4; *P < 0.01, **P < 0.0001, 2-way ANOVA followed by the Bonferroni-Dunn test for multiple comparisons. (B) Mouse dermal fibroblasts were treated as in Figure 2A. The expression of POSTN in cell lysates was measured by western blot analysis. β-actin served as an internal control. (C) Bars show the results of densitometric analysis of POSTN relative to β-actin. Mean ± SD of each group are shown. N = 3; *P < 0.0001, 2-way ANOVA followed by the Bonferroni-Dunn test for multiple comparisons. (D) Mouse dermal fibroblasts were treated as in Figure 2A. Expression of Col1A1 and Col1A2 in culture medium was measured by protein gel blot analysis. β-actin served as an internal control. (E) Bars show the densitometric analysis of Col1A1 relative to β-actin. The mean ± SD is shown for each group. N = 3; *P < 0.05, **P < 0.001, 2-way ANOVA followed by the Bonferroni-Dunn test for multiple comparisons. (F) Normal Human dermal fibroblasts were pre-treated with 10−7 M of OCT for 2 h and treated with IL-4 (10 ng/ml), IL-13 (10 ng/ml), or TGFβ (10 ng/ml) for an additional 24 h. Expression of POSTN was measured in cell lysates by western blot analysis. β-actin served as an internal control. (G) Bars show the densitometric analysis of POSTN relative to β-actin. The mean ± SD of each group is shown. N = 3; *P < 0.0001, 2-way ANOVA followed by the Bonferroni-Dunn test for multiple comparisons.