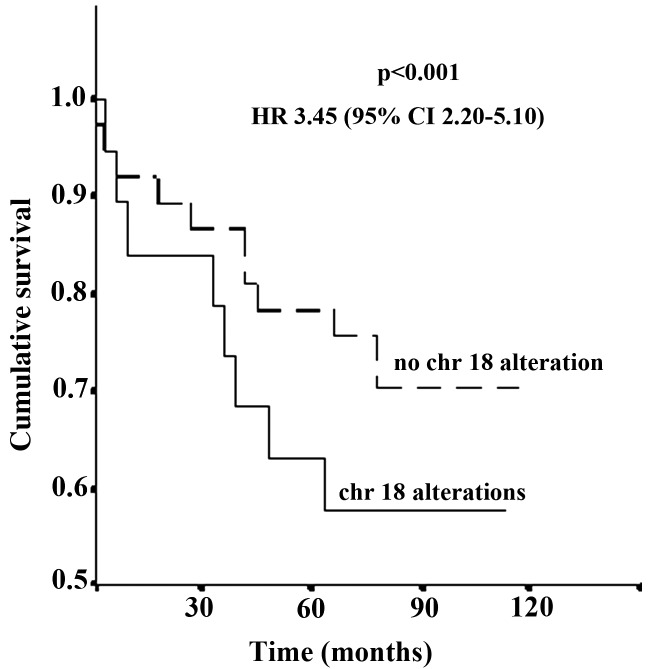
Figure 1.
Kaplan-Meier curves illustrating the association between LOH on chr 18 (HR, 3.45; 95% CI, 2.20–5.10; P<0.001) and cancer-specific survival patient probability. Mortality was used as endpoint in Kaplan-Meier analysis. Time (months), time from initial diagnosis to first recurrence (months); LOH, loss of heterozygosis; chr, chromosome; HR, hazard ratio; CI, confidence interval.

