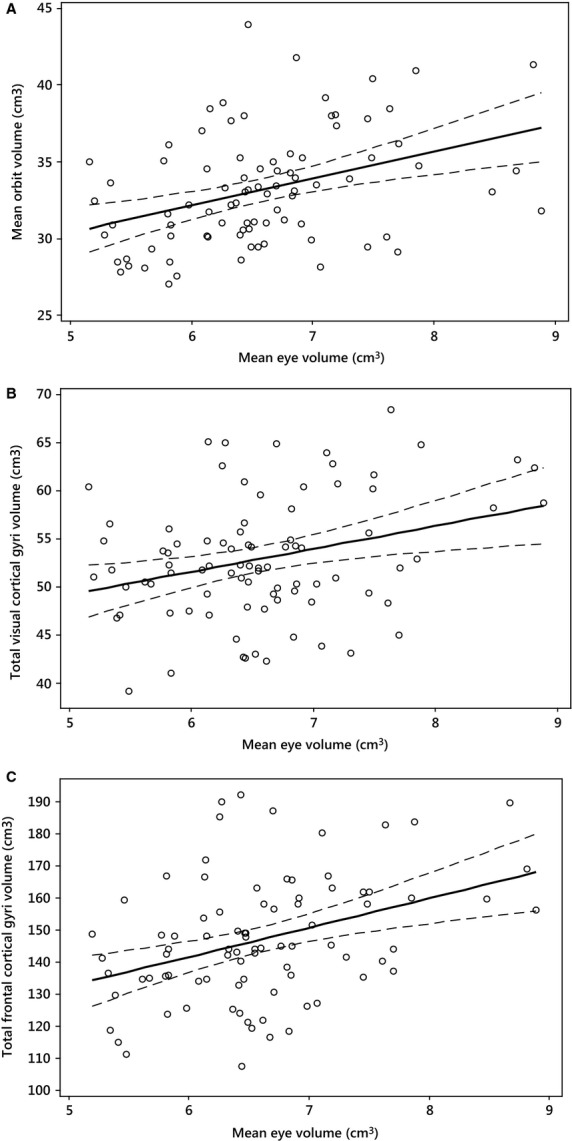
Figure 3.

(A) Fitted line plots of mean eye volume vs. mean orbital volume, (B) mean eye volume vs. total of visual cortical gyri volumes generated using Brain Parser 56 ROI, and (C) mean eye volume vs. total of frontal cortical gyri volumes using Brain Parser 56 ROI.
