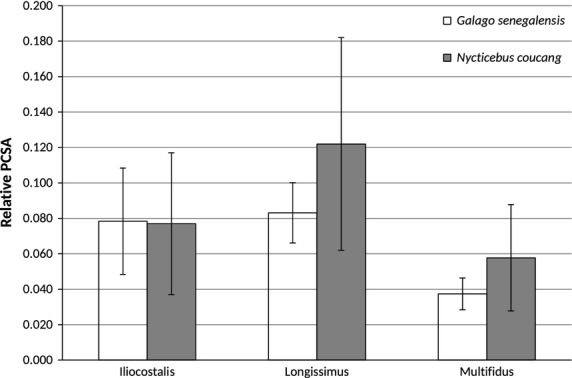
Figure 11.

Bar graph of relative epaxial muscle physiological cross-sectional areas (PCSAs; mean ± SD). Contrary to predictions, G. senegalensis does not have relatively smaller PCSAs compared with N. coucang. Note, however, the high standard deviations for N. coucang, particularly for longissimus PCSA.
