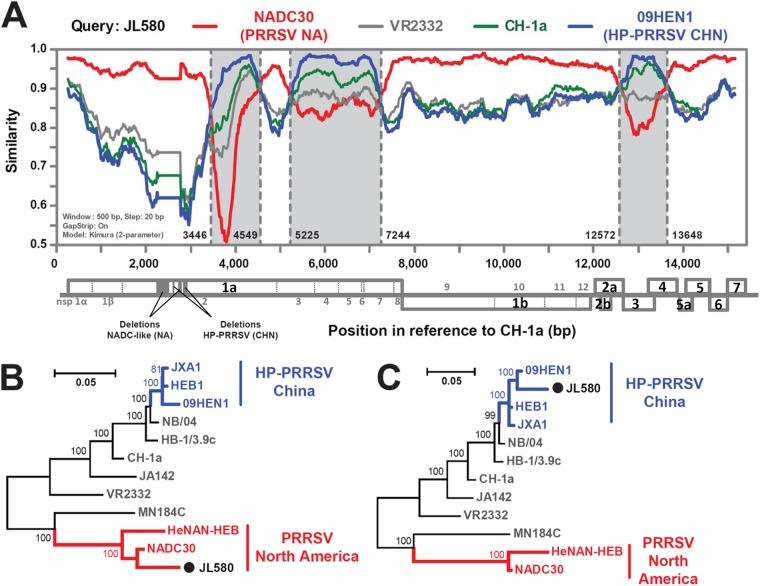
FIG 2.
Recombination analysis of strain JL580. (A) Genome scale similarity comparisons of JL580 (query) with NADC30 (red), 09HEN1 (blue), CH-1a (green), and VR2332 (gray). Recombination breakpoints are shown as black dotted lines, with the locations indicated at the bottom. The background color of the major parental regions (parental region A) is white, whereas that of the minor parental regions (parental region B) is gray. Below the similarity plot is a full genome structure, with reference to CH-1a, in which the positions and boundaries of the major ORFs, nsp-encoding genes within ORF1a and ORF2b, and gaps are shown. Phylogenies of parental regions A (B) and B (C) are shown below the similarity plot. The major parental group (NADC30-like viruses) is shown in red; the minor parental group (classic HP-PRRSV in China) is shown in blue.

