
FIG 2.
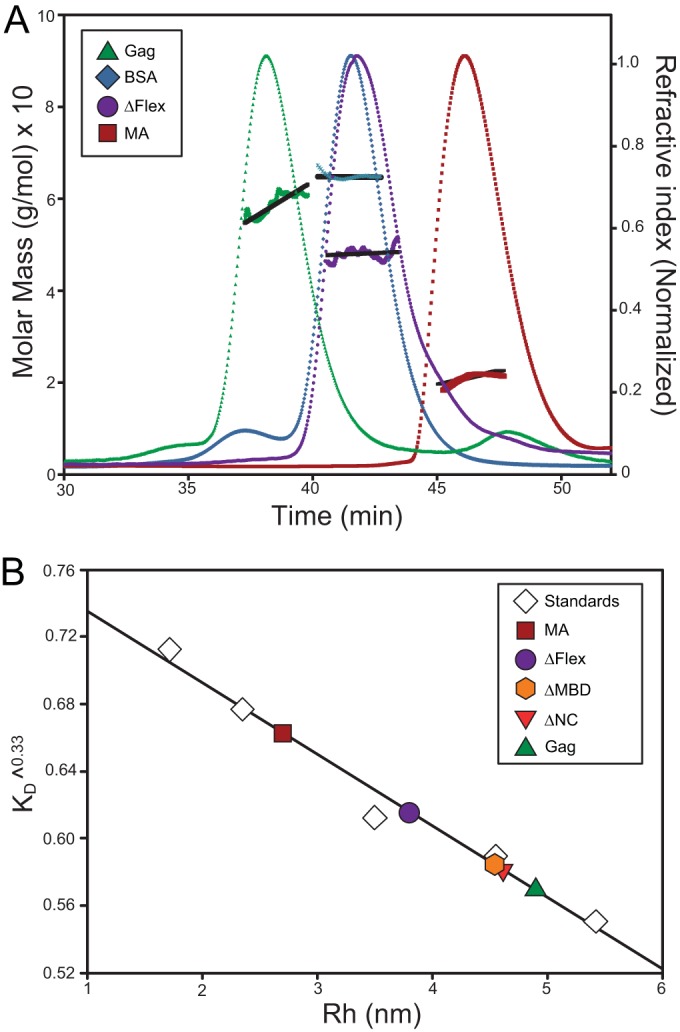
SEC and multiangle static light scattering (SLS) of RSV Gag and Gag-derived proteins. (A) RSV Gag, ΔFlex, and MA are shown with BSA. Gag solutions and BSA at 1.5 mg/ml were chromatographed on a Superose 12 column. Elution of protein was simultaneously monitored by determining the refractive index, giving rise to the elution profiles, and by SLS, yielding the data points above the elution profiles. The points indicate the molar mass of the protein in each fraction. These masses, in turn, were averaged over the breadth of each peak, producing the roughly horizontal lines above the elution profiles. (B) The Rh values of Gag and derived constructs determined from the elution time in panel A and in addition the Rh values for ΔMBD and ΔNC are shown. The column was calibrated with a series of proteins of known Rh values, as described in Materials and Methods. The graph shows the cube root of the column distribution coefficient KD plotted against the Rh value of the proteins.