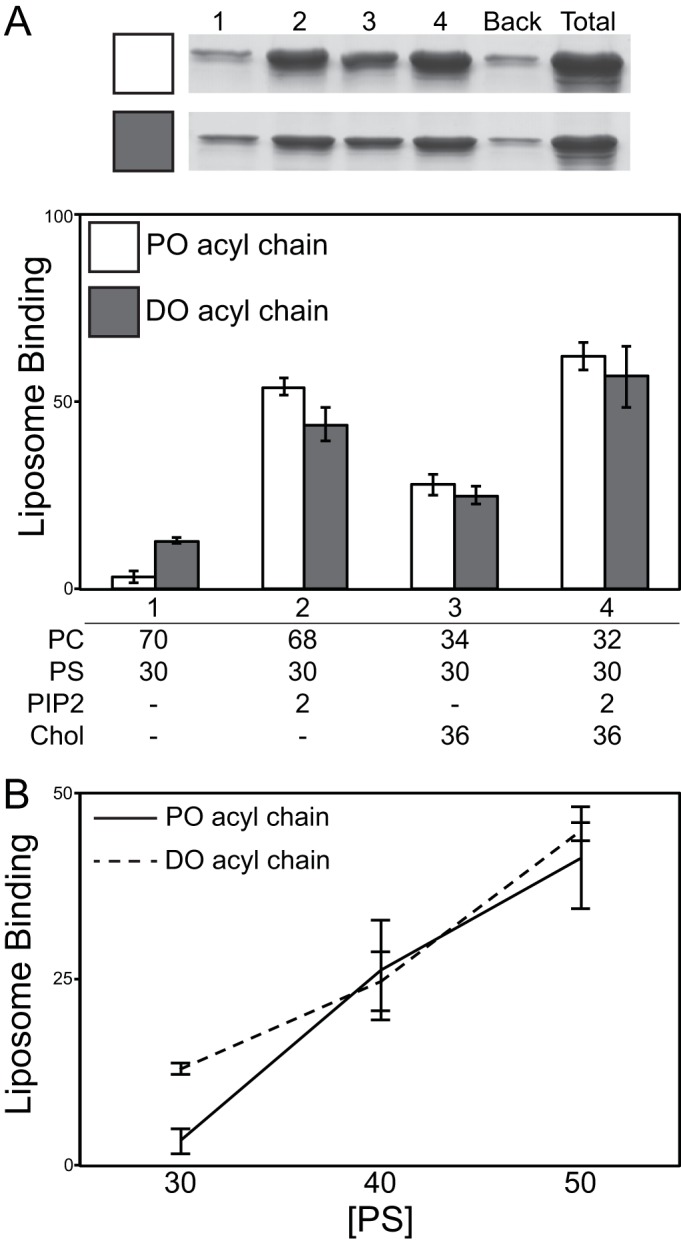
FIG 6.

Gag and electrostatic sensor protein response to physiological concentrations of PI(4,5)P2 and cholesterol. (A) An example of stained gels for Gag pelleting results is shown at the top. Numbered lanes 1 to 4 correspond to bar graphs, with lipid compositions listed below the bar graphs. Back, background protein (pelleted protein in the absence of liposomes); Total, total protein. Effects of PI(4,5)P2 (PIP2) and cholesterol in POPC/POPS and DOPC/DOPS lipid mixtures on Gag membrane interaction are shown in the bar graph. (B) Percent of total Gag bound to LUVs with increasing PS concentration for PO acyl chain and DO acyl chain membranes.
