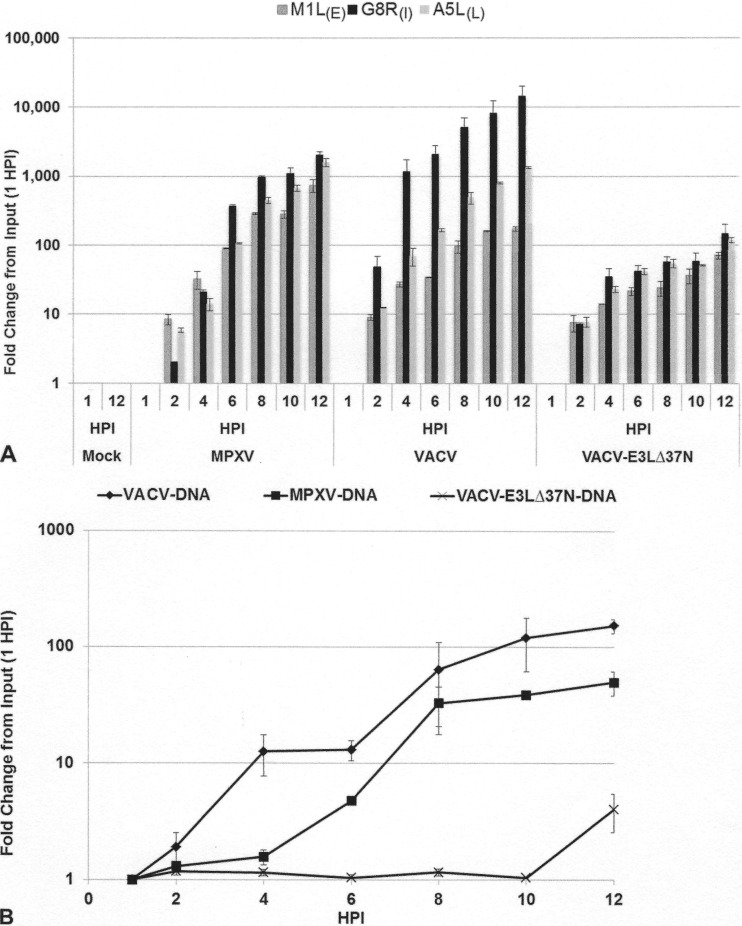
FIG 6.
(A) Gene expression in JC cells. JC cells were either mock infected or infected with MPXV, VACV-E3LΔ37N, or VACV at an MOI of 5. RNA was extracted at 1, 2, 4, 6, 8, 10, and 12 hpi. Real-time quantitative PCR was performed with primers specific for M1L (early [E]), G8R (intermediate [I), and A5L (late [L]) viral gene transcripts. The transcript level of each gene was graphed as the fold change from the amount input (at 1 hpi). Data represent means with standard errors from multiple experiments. (B) Genomic replication in JC cells. Cells were infected with VACV, VACV-E3LΔ37N, or MPXV at an MOI of 5. Cells were harvested at 1, 2, 4, 6, 8, 10, and 12 hpi, and total DNA was extracted with phenol chloroform. Total DNA (500 ng) was used for real-time PCR with VACV G8R gene-specific primers. The graph presents the fold change in genomic DNA as the fold change from the amount input (at 1 hpi), along with transcript levels from Fig. 5A. Data represent means with standard errors from multiple experiments.

