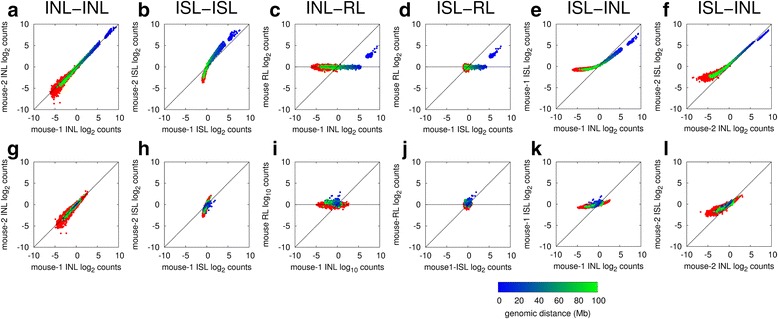
Fig. 7.

Reproducibility of the corrected Hi-C matrices. Element-wise comparison of coverage-corrected (a–f) and coverage- and distance-corrected (g–l) Hi-C matrices as indicated. The scatter plots show the log2-corrected counts in one dataset against the corresponding count values in the second dataset, for all cis-chromosomal (blue to green color varying with genomic distance) and trans-chromosomal (red) bin interaction counts. The correction of Imakaev et al. [22] was applied, using a bin resolution of 10 Mb. INL in-nucleus ligation, ISL in-solution ligation, RL random ligation
