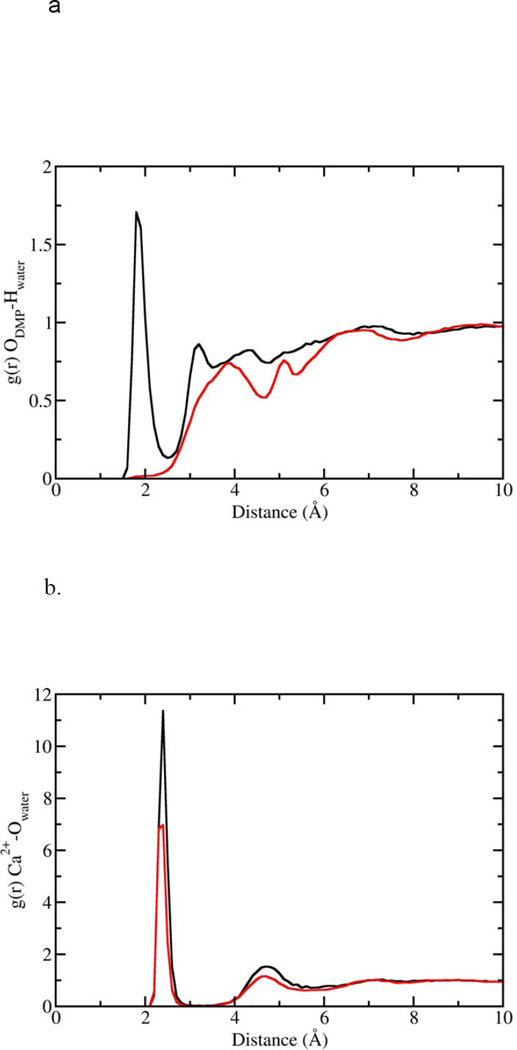
Figure 6.
Radial distribution functions for water interacting with the DMP− and Ca2+. (a) Hydrogen atoms of water interacting with anionic DMP− oxygens. Black curve corresponds to DMP− in free solution; red curve corresponds to DMP− bound to Ca2+. (b) Oxygen of water interacting with Ca2+. Black curve represents Ca2+ unbound to DMP−; red curve represents Ca2+ bound to DMP−.

