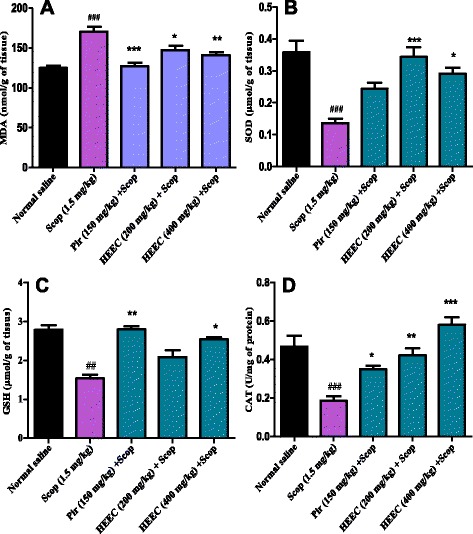
Fig. 5.

Effect of the hydroalcoholic extract of E. coccinae administration on MAD (a) SOD (b), GSH (c) and CAT (C) level of the brain tissue. Data was analyzed by one-way ANOVA followed by Bonferroni post-hoc test. Each column represents mean ± S.E.M. of 6 animals. ***p < 0.001, **p < 0.01 and *p < 0.05 when compared to scopolamine treated group; ### p < 0.001, when compared to normal animals
