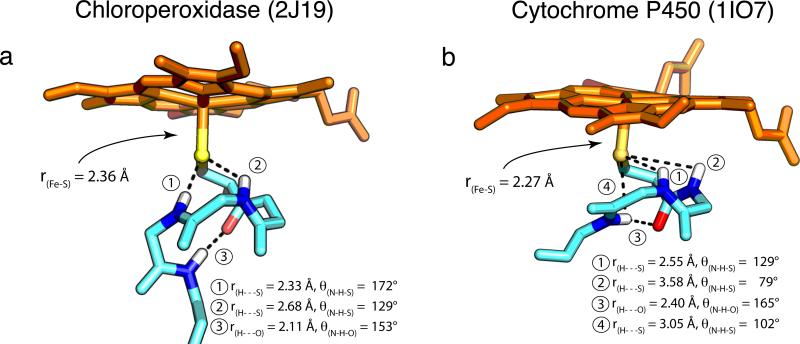
Figure 1.
P450 displays weaker/poorer H-bonding interactions compared to CPO. H-bonding metrics and Fe-S distances from the crystal structures of (a) ferric CPO (2J19) and (b) ferric CYP119A1 (1IO7) are shown. The H-bonding metrics for CYP119A1 are typical of P450s. Average distances (angles) for the four P450s discussed in this paper [CYP119A1, CYP119A2 (3B4X), CYP158A2 (1SE6), and CYP101 (1PHC)] are: ① 2.59±0.12Å (124±3°); ② 3.59±0.08Å (76±4°); ③ 2.41±0.25Å (161±6°); ④ 3.09±0.18Å (99±3°). Protein Data Bank accession codes for each structure are given in parentheses.

