
Figure 3. Snai1 and Snai2 Repress Differentiation Genes.
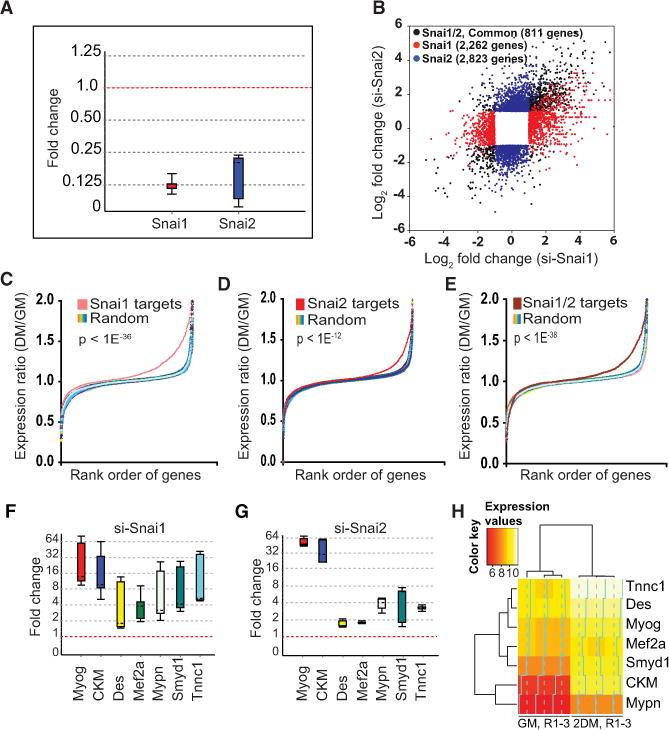
(A) Transient in vivo depletion of Snai1 and Snai2 in growing primary skeletal myoblasts by siRNA. Whisker box plots were generated using REST 2009 Qiagen software (Pfaffl et al., 2002) to assess the relative abundance of transcript level using gene-specific primers (Supplemental Experimental Procedures). The box represents 50% of all observations, dashed line inside the box represents median. Top and bottom whiskers represent upper and lower twenty-fifth percentiles, respectively. GAPDH (housekeeping gene) was used as reference for normalization.
(B) Scatterplot of significantly regulated genes in si-Snai1- and si-Snai2-treated myoblasts. RNA-seq analysis was performed on purified mRNA. Black circles represent significantly regulated (fold change >2, p value <10−5) genes common between si-Snai1- and si-Snai2-treated myoblasts, red circles represent genes that are significantly up- or downregulated in si-Snai1, and blue circles represent genes that are significantly up- or downregulated in si-Snai2-treated myoblasts. An si-Scrambled siRNA was used as a control.
(C) Genes that are repressed by Snai1 are upregulated during differentiation. Gene expression profile of Snai1 targets (red) versus an equal number of randomly selected set of genes (rainbow) taken from microarray analysis of wild-type myoblasts and myotubes shows that genes that are repressed by Snai1 are primarily upregulated during differentiation. The ratio of myotubes to myoblasts (DM/GM) is log2 ratio of normalized expression between myotubes, 2 days in DM, divided by their corresponding expression values in myoblasts. Controls (rainbow) represent ten randomly selected sets of probes after randomizing the order of probes on Affymetrix chip. p values are based on the Kolmogorov-Smirnov probability distribution.
(D and E) Similar analysis as in (C) for Snai2 and Snai1/2 targets, respectively, showing that genes repressed by Snai2 are primarily those that are upregulated during differentiation.
(F) Real-time RT-qPCR validation of a subset of Snai1 targets showing upregulation of these genes in si-Snai1-treated myoblasts relative to si-Scrambled treated control myoblasts, as described in (A). Also, see the Supplemental Experimental Procedures for primer sequences.
(G) Real-time RT-qPCR validation of a subset of Snai2 target genes using gene-specific primers as described in (F).
(H) A heat map based on the hierarchical clustering showing the expression pattern of genes from (F) and (G) during muscle cell differentiation program. Input expression data are from microarray analysis.