
Figure 6. Enhancer Switching on Differentiation-Induced Genes.
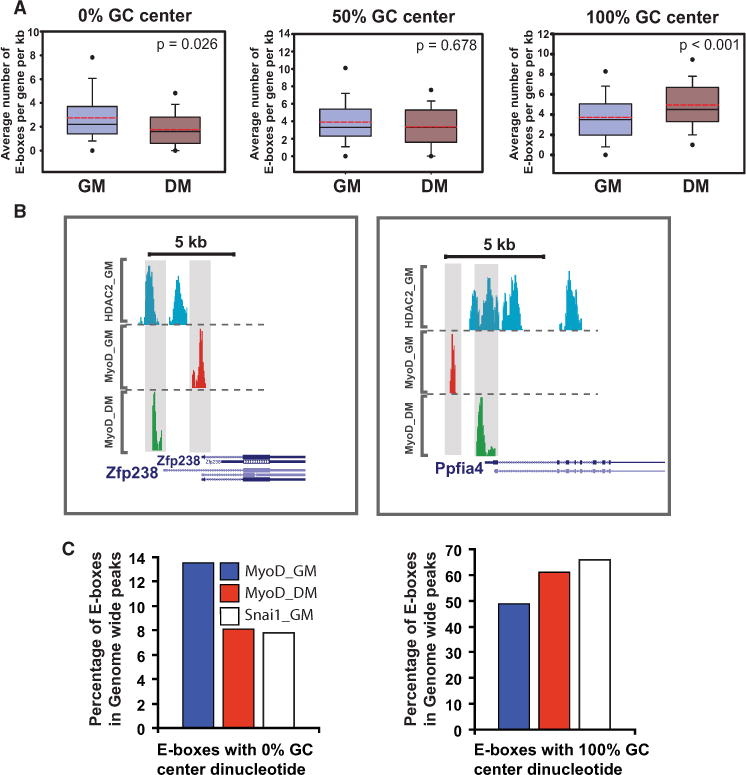
(A) Distribution of E box classes with various GC content in their center dinucleotides associated with MyoD peaks in growth and differentiation for MyoD targets genes that are upregulated during myogenic differentiation for all MyoD peaks within ±10 kb of the TSS. y axis shows the average number of E boxes per peaks per gene, normalized per kilobase. In-box dashed red line indicates mean, solid line (black) indicates median. Lower and upper solid circles indicate the fifth and ninety-fifth percentiles, respectively. p values are calculated based on the Wilcoxon signed rank test.
(B) Binding pattern of MyoD on two representative genes from (A).
(C) Genome-wide distribution pattern of E boxes (0%, 50%, and 100% GC content in their center dinucleotides) among MyoD GM, MyoD 2DM, and Snai1 GM ChIP-Seq data sets.