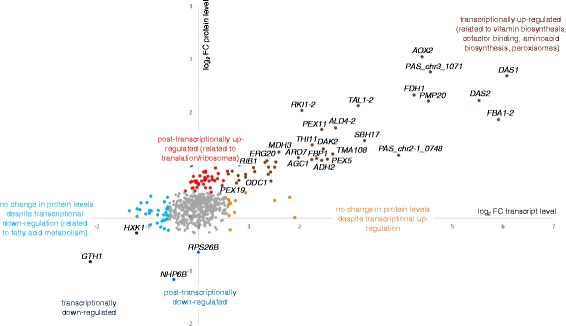
Fig. 1.

Co-regulation of transcripts and proteins of P. pastoris grown on methanol/glycerol compared to glucose in chemostats at μ = 0.1 h−1. Log2 fold changes of transcripts versus log2 fold changes of proteins for the 575 data pairs are shown which have been grouped based on their regulation patterns. Significantly enriched GO terms in these groups are indicated. Criteria for up/down-regulation of transcript and protein levels are described in the Methods section
