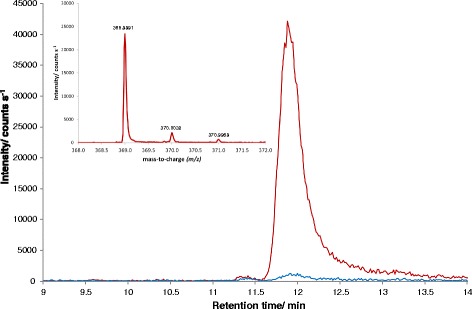
Fig. 2.

Extracted ion chromatogram (m/z = 368.9993 ± 10 ppm) of a sample grown on methanol (red) or glucose (blue) showing the sedoheptulose-1,7-bisphosphate peak at a retention time of 12 min. In the upper left corner the mass spectrum (m/z) of the peak of the methanol-grown sample after background subtraction is shown. The difference between the measured accurate mass and the calculated exact mass is 0.53 ppm (0.2 mDa)
