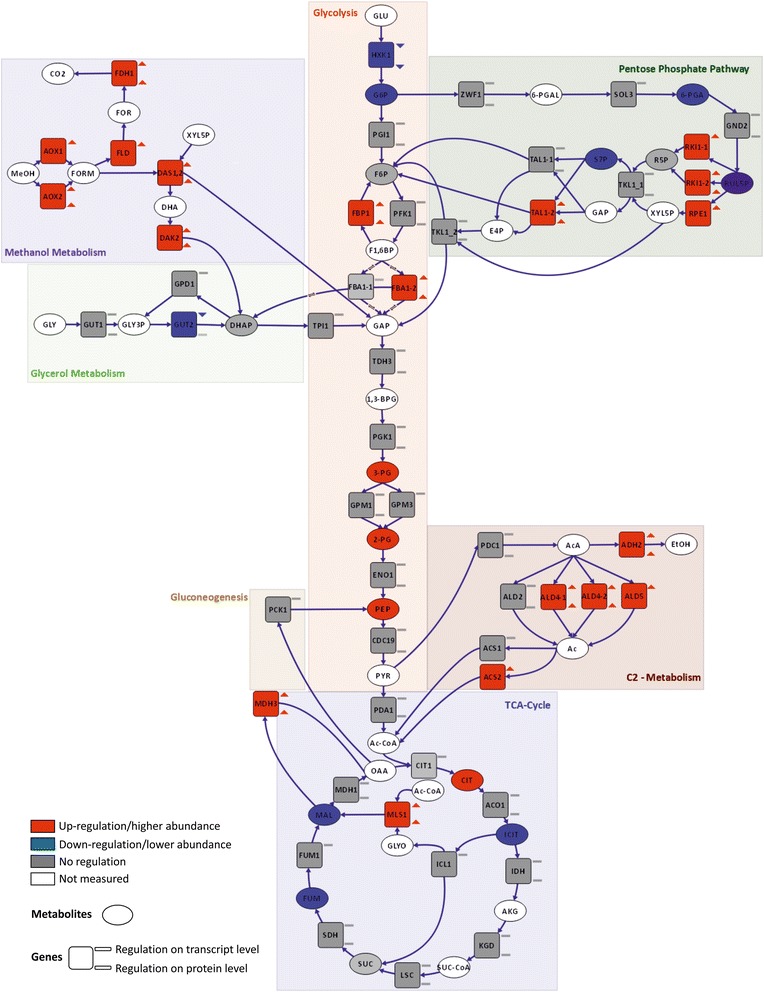
Fig. 4.

Differential regulation of central carbon metabolism comparing methanol/glycerol- and glucose-grown cells. Visualization of changes in transcript (square, upper symbol), protein (square, lower symbol), and metabolite (oval) levels. Red: up-regulation on methanol/glycerol; blue: down-regulation on methanol/glycerol; gray: not differentially regulated; white/no symbol: not measured. Criteria for up-/down-regulation of transcript, protein, and metabolite levels are described in the Methods section
