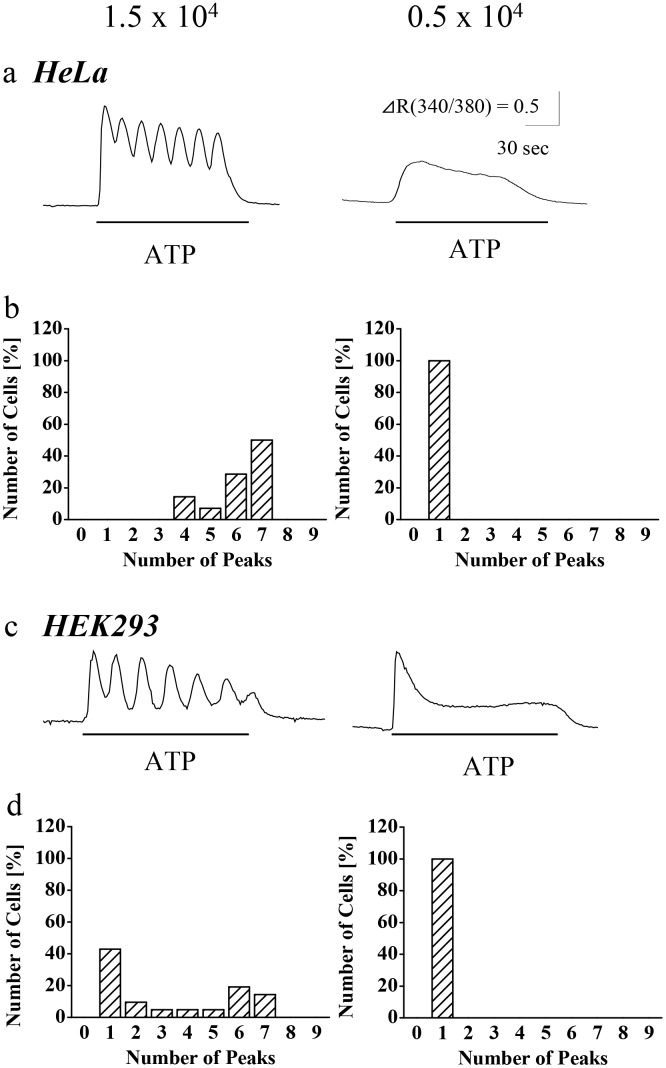
Fig 2. Effects of cell density to the calcium response patterns in HeLa cells (a, b) and HEK293 cells (c, d) in response to ATP.
Cells were seeded at a density of 1.5 x 10⁴ or 0.5 x 10⁴ cells/cm2. Representative patterns (a and c) and peak histograms (b and d) of calcium increase in response to 100 μM ATP stimulation (2 min, under lines) are shown. n = 14–28 cells

