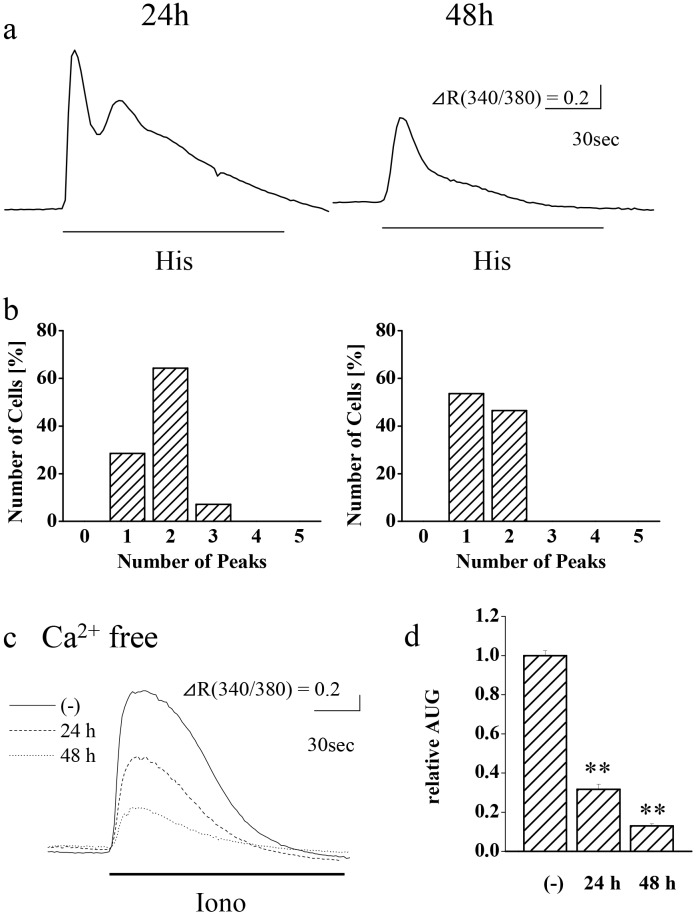
Fig 3. Involvement of MAP kinase cascade in the calcium increase pattern in HeLa cells.
Cells were treated with 1 μM U0126 for 24 h or 48 h. (a) Representative patterns and (b) peak histograms of calcium increase in response to stimulation with 30 μM histamine (His; 2 min, under lines) are shown. (c) Representative patterns and (d) comparison of calcium store contents from the area under the graph (AUG) of calcium release in response to treatment with 2.5 μM ionomycin (Iono; under lines) in the absence of extracellular calcium. Extracellular solution was changed to calcium free BSS 30 sec prior to ionomycin stimulation. ** p < 0.01, n = 14–28 cells.

