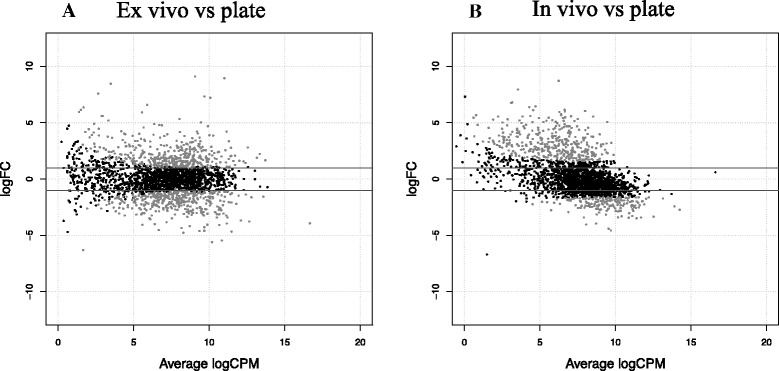
Figure 1.

MA plots generated by EdgeR. Transcript expression profiles in the two comparisons performed: ex vivo vs plate culture (A) and in vivo vs plate culture (B). For each gene, log2(fold change) between the two conditions is plotted (M, y axis) against the gene’s log2(average expression) in the two samples (A, x axis). Horizontal lines indicate 2-fold changes. Grey dots highlight the genes at 5% FDR.
