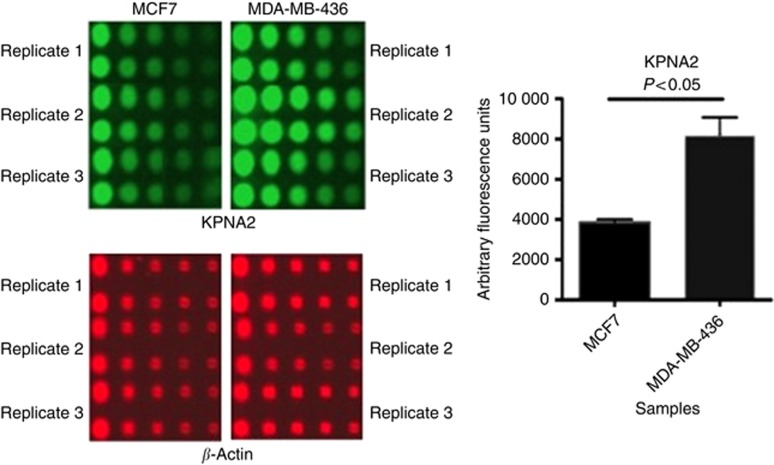
Figure 5.
KPNA2 protein levels detected by RPPA in MCF7 and MDA-MB-436 cells. For image of nitrocellulose slide spotted with different cell lysates; the red fluoresence represents detection of β-actin, whereas green fluorsence for KPNA2. Images of scanned nitrocellulose slides printed with extracted protein from cell lines and probed with the antibodies against the target proteins. Five two-fold dilutions of each sample were printed in duplicate. Background was subtracted and the intensity of each spot was normalised to its corresponding β-actin level. Six experimental replicates for each cell linewere used. Error bars represent mean (s.d.). As shown from the graph the expression level of KPNA2 was lower in MCF7 compared with MDA-MB-436 (P<0.05).

