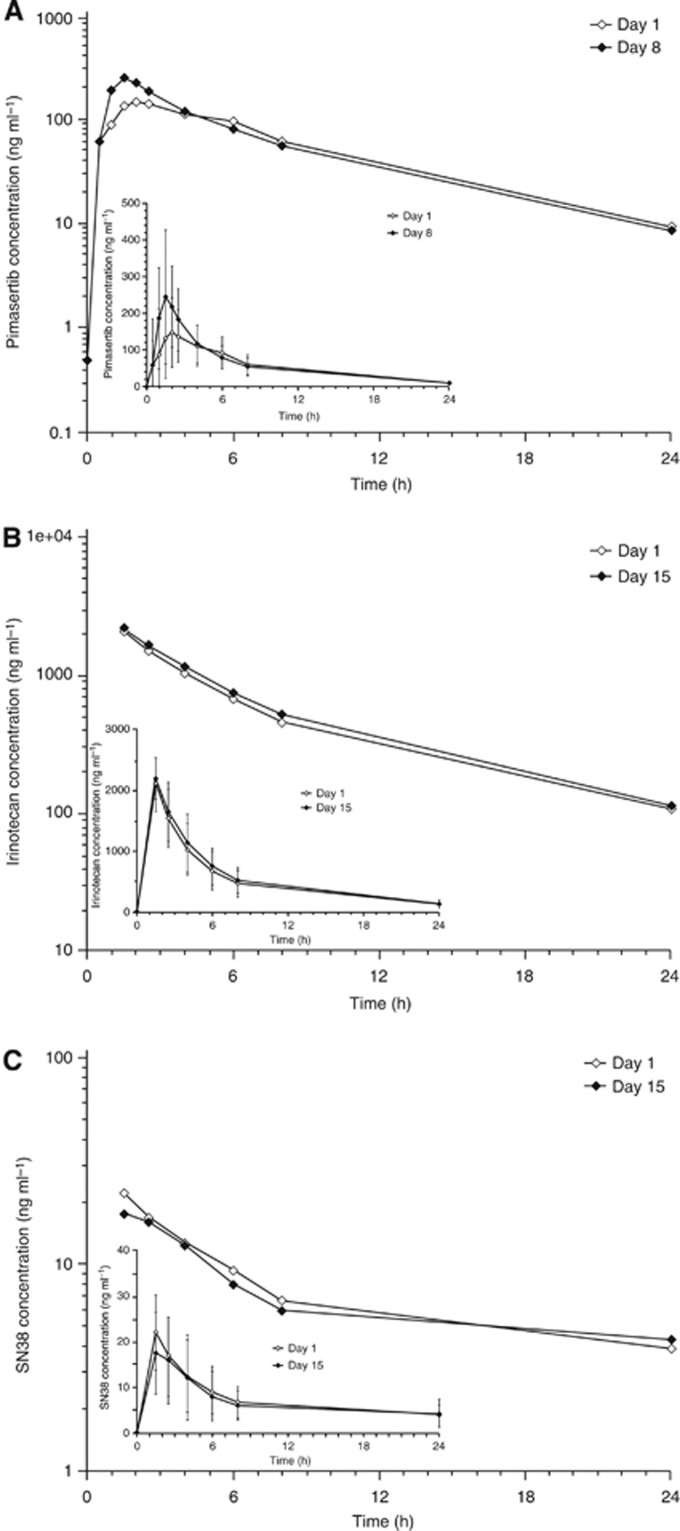
Figure 1.
(A) Plasma concentration–time profiles of pimasertib 45 mg per day in the presence (day 1, open diamonds) and absence (day 8, closed diamonds) of FOLFIRI. Data (mean±s.d.) are shown as semilog (main figure) and linear (inset) plots. (B) Plasma concentration–time profiles of irinotecan in the presence (day 1, open diamonds) and absence (day 15, closed diamonds) of pimasertib 45 mg per day. Data (mean±s.d.) are shown as semilog (main figure) and linear (inset) plots. (C) Plasma concentration–time profiles of SN-38 in the presence (day 1, open diamonds) and absence (day 15, closed diamonds) of pimasertib 45 mg per day. Data (mean±s.d.) are shown as semilog (main figure) and linear (inset) plots.

