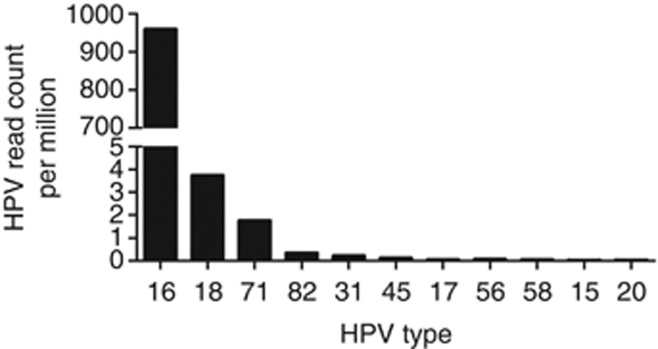
Figure 2.
Quantitative representation, by number of reads, of HPV types detected in cervical tumours. The graph represents distribution of total number of HPV reads per million of total reads for all HPV types detected across 17 cervical samples. HPV16 has the highest number of reads across 17 samples followed by HPV(18, 71, 45, 31, 82, 17, 56, 58, 15, 20) in the decreasing order of their read counts.

