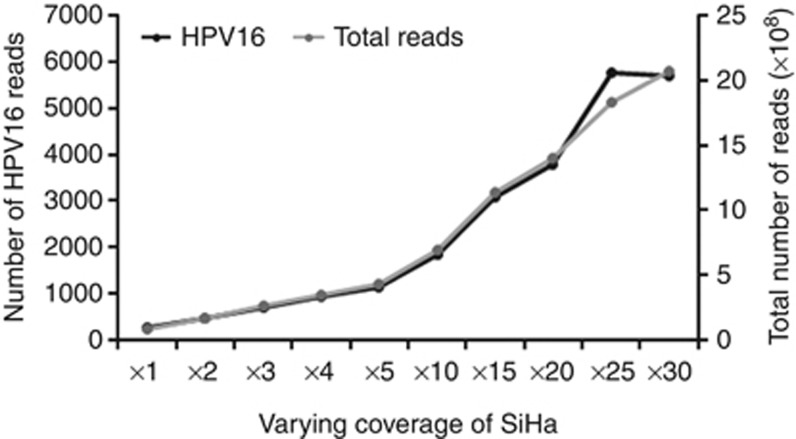
Figure 4.
Sensitivity of HPVDetector as a function of increasing genome sequence coverage. SiHa WGS data were downsampled to the coverage of 1 × , 2 × , 3 × , 4 × , 5 × , 10 × , 15 × , 20 × , 25 × , and 30 × . HPV16 reads (black) were counted using HPVDetector at varying coverage and plotted along with total number of reads (grey).

