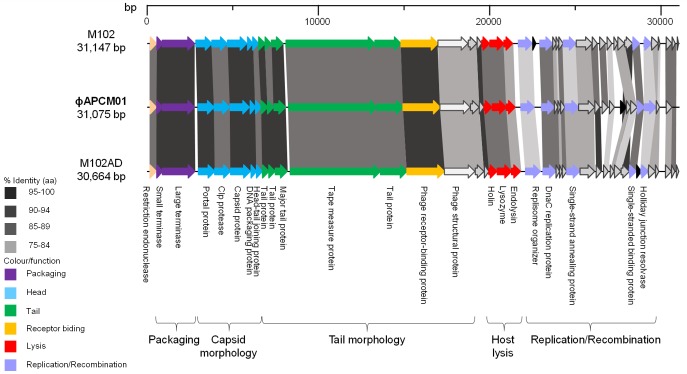
Fig 5. Genomic organization of ɸAPCM01 compared with that of phages M102 and M102AD.
Each arrow represents an ORF, with the colour representing the putative function of the encoded protein indicated on the right. Percent amino acid identity between adjacent genomes is colour coded as outlined to the left.

