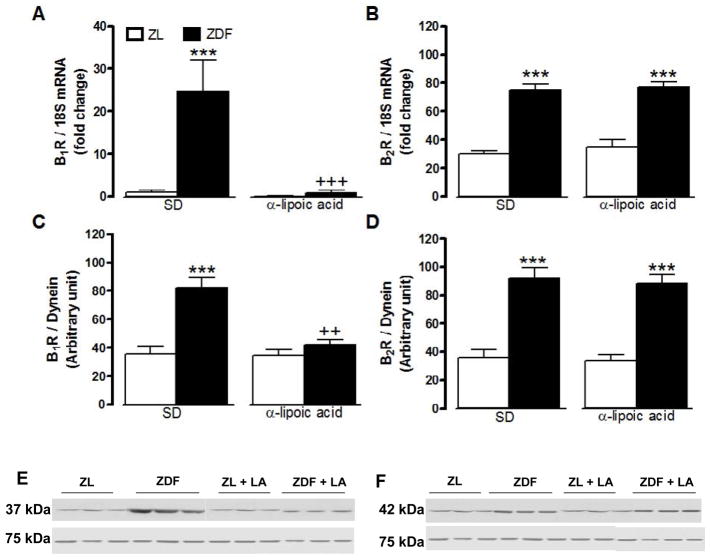
Figure 4.
Effect of 6-week treatment with α-lipoic acid (LA) or standard diet (SD) on the expression of kinin B1R (A, C, E) and B2R (B, D, F) in the gastrocnemius skeletal muscle of 12 weeks Zucker diabetic fatty (ZDF) rats and age-matched Zucker lean (ZL) rats. Shown are mRNA (A, B) and protein (C–F) expression levels of B1R (37 kDa) and B2R (42 kDa). Dynein (75 kDa) and 18S mRNA were used as standards. Data are the mean ± S.E.M of 3–8 rats/group. Statistical comparison with ZL (*) and ZD (+) in SD is indicated by ++ P<0.01; ***,+++ P<0.001.

