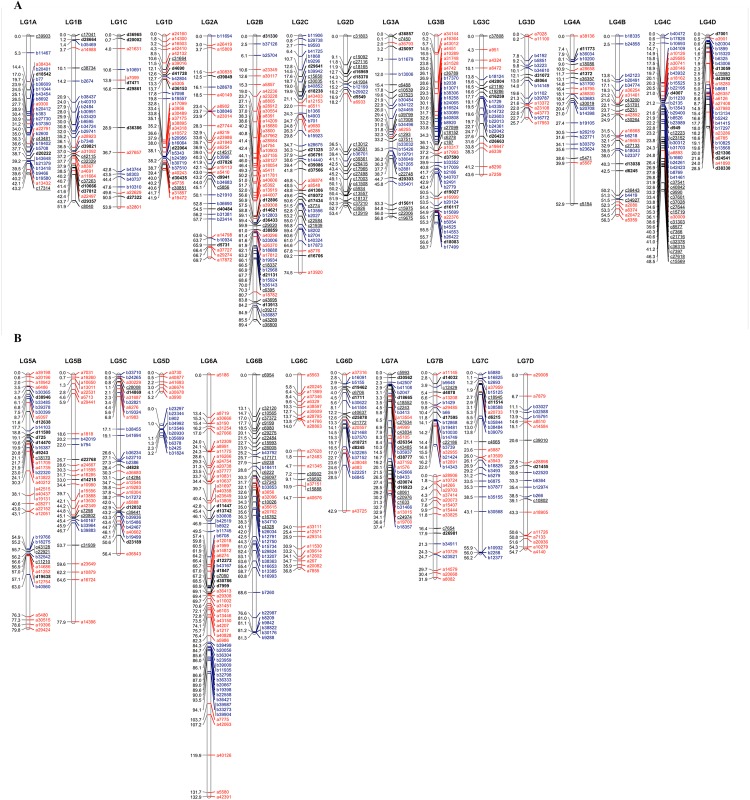
Fig 1. A SNP-based linkage map of a F. ×ananassa mapping population derived from the cross ‘Sonata’ × ‘Babette’.
Map distances are given in centi-Morgans (cM), marker colours indicate: Red–markers segregating in the ‘Sonata’ genetic background only; Blue–markers segregating in the ‘Babette’ genetic background only; Black–markers segregating in both genetic backgrounds (1:1:1:1 and 1:2:1 segregations are indicated with bold and underscore respectively).

